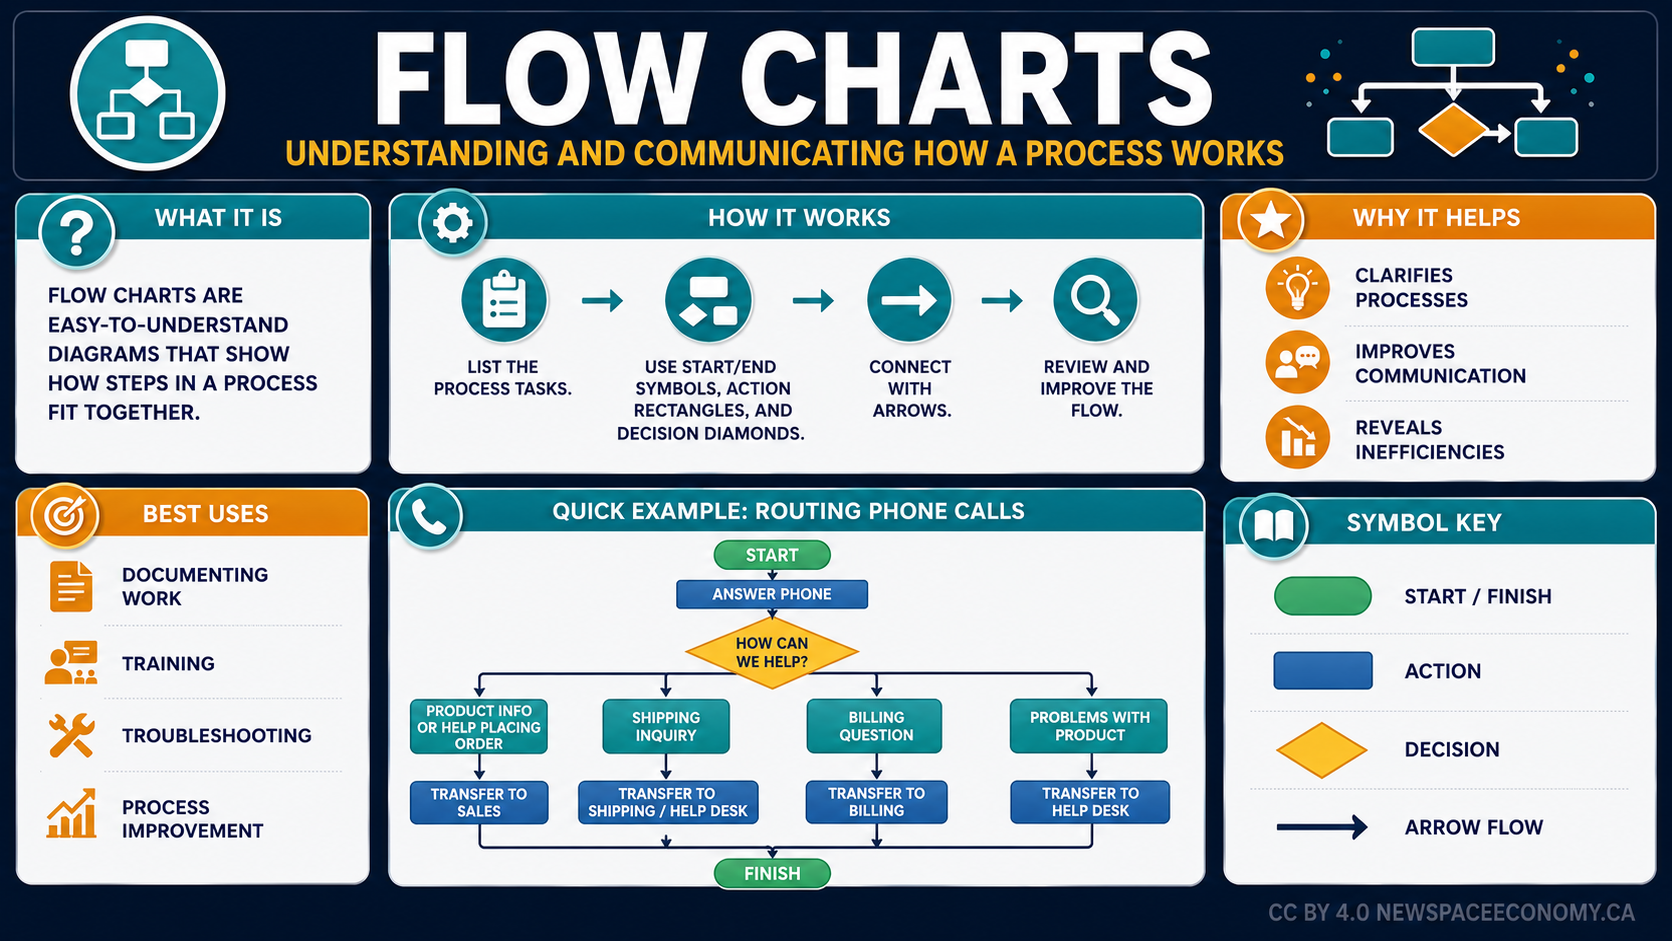
An instructional infographic explains how process diagrams represent tasks, decisions, and pathways. It includes a phone-call routing example and lists uses such as documentation, training, troubleshooting, and process improvement.
More From This Group