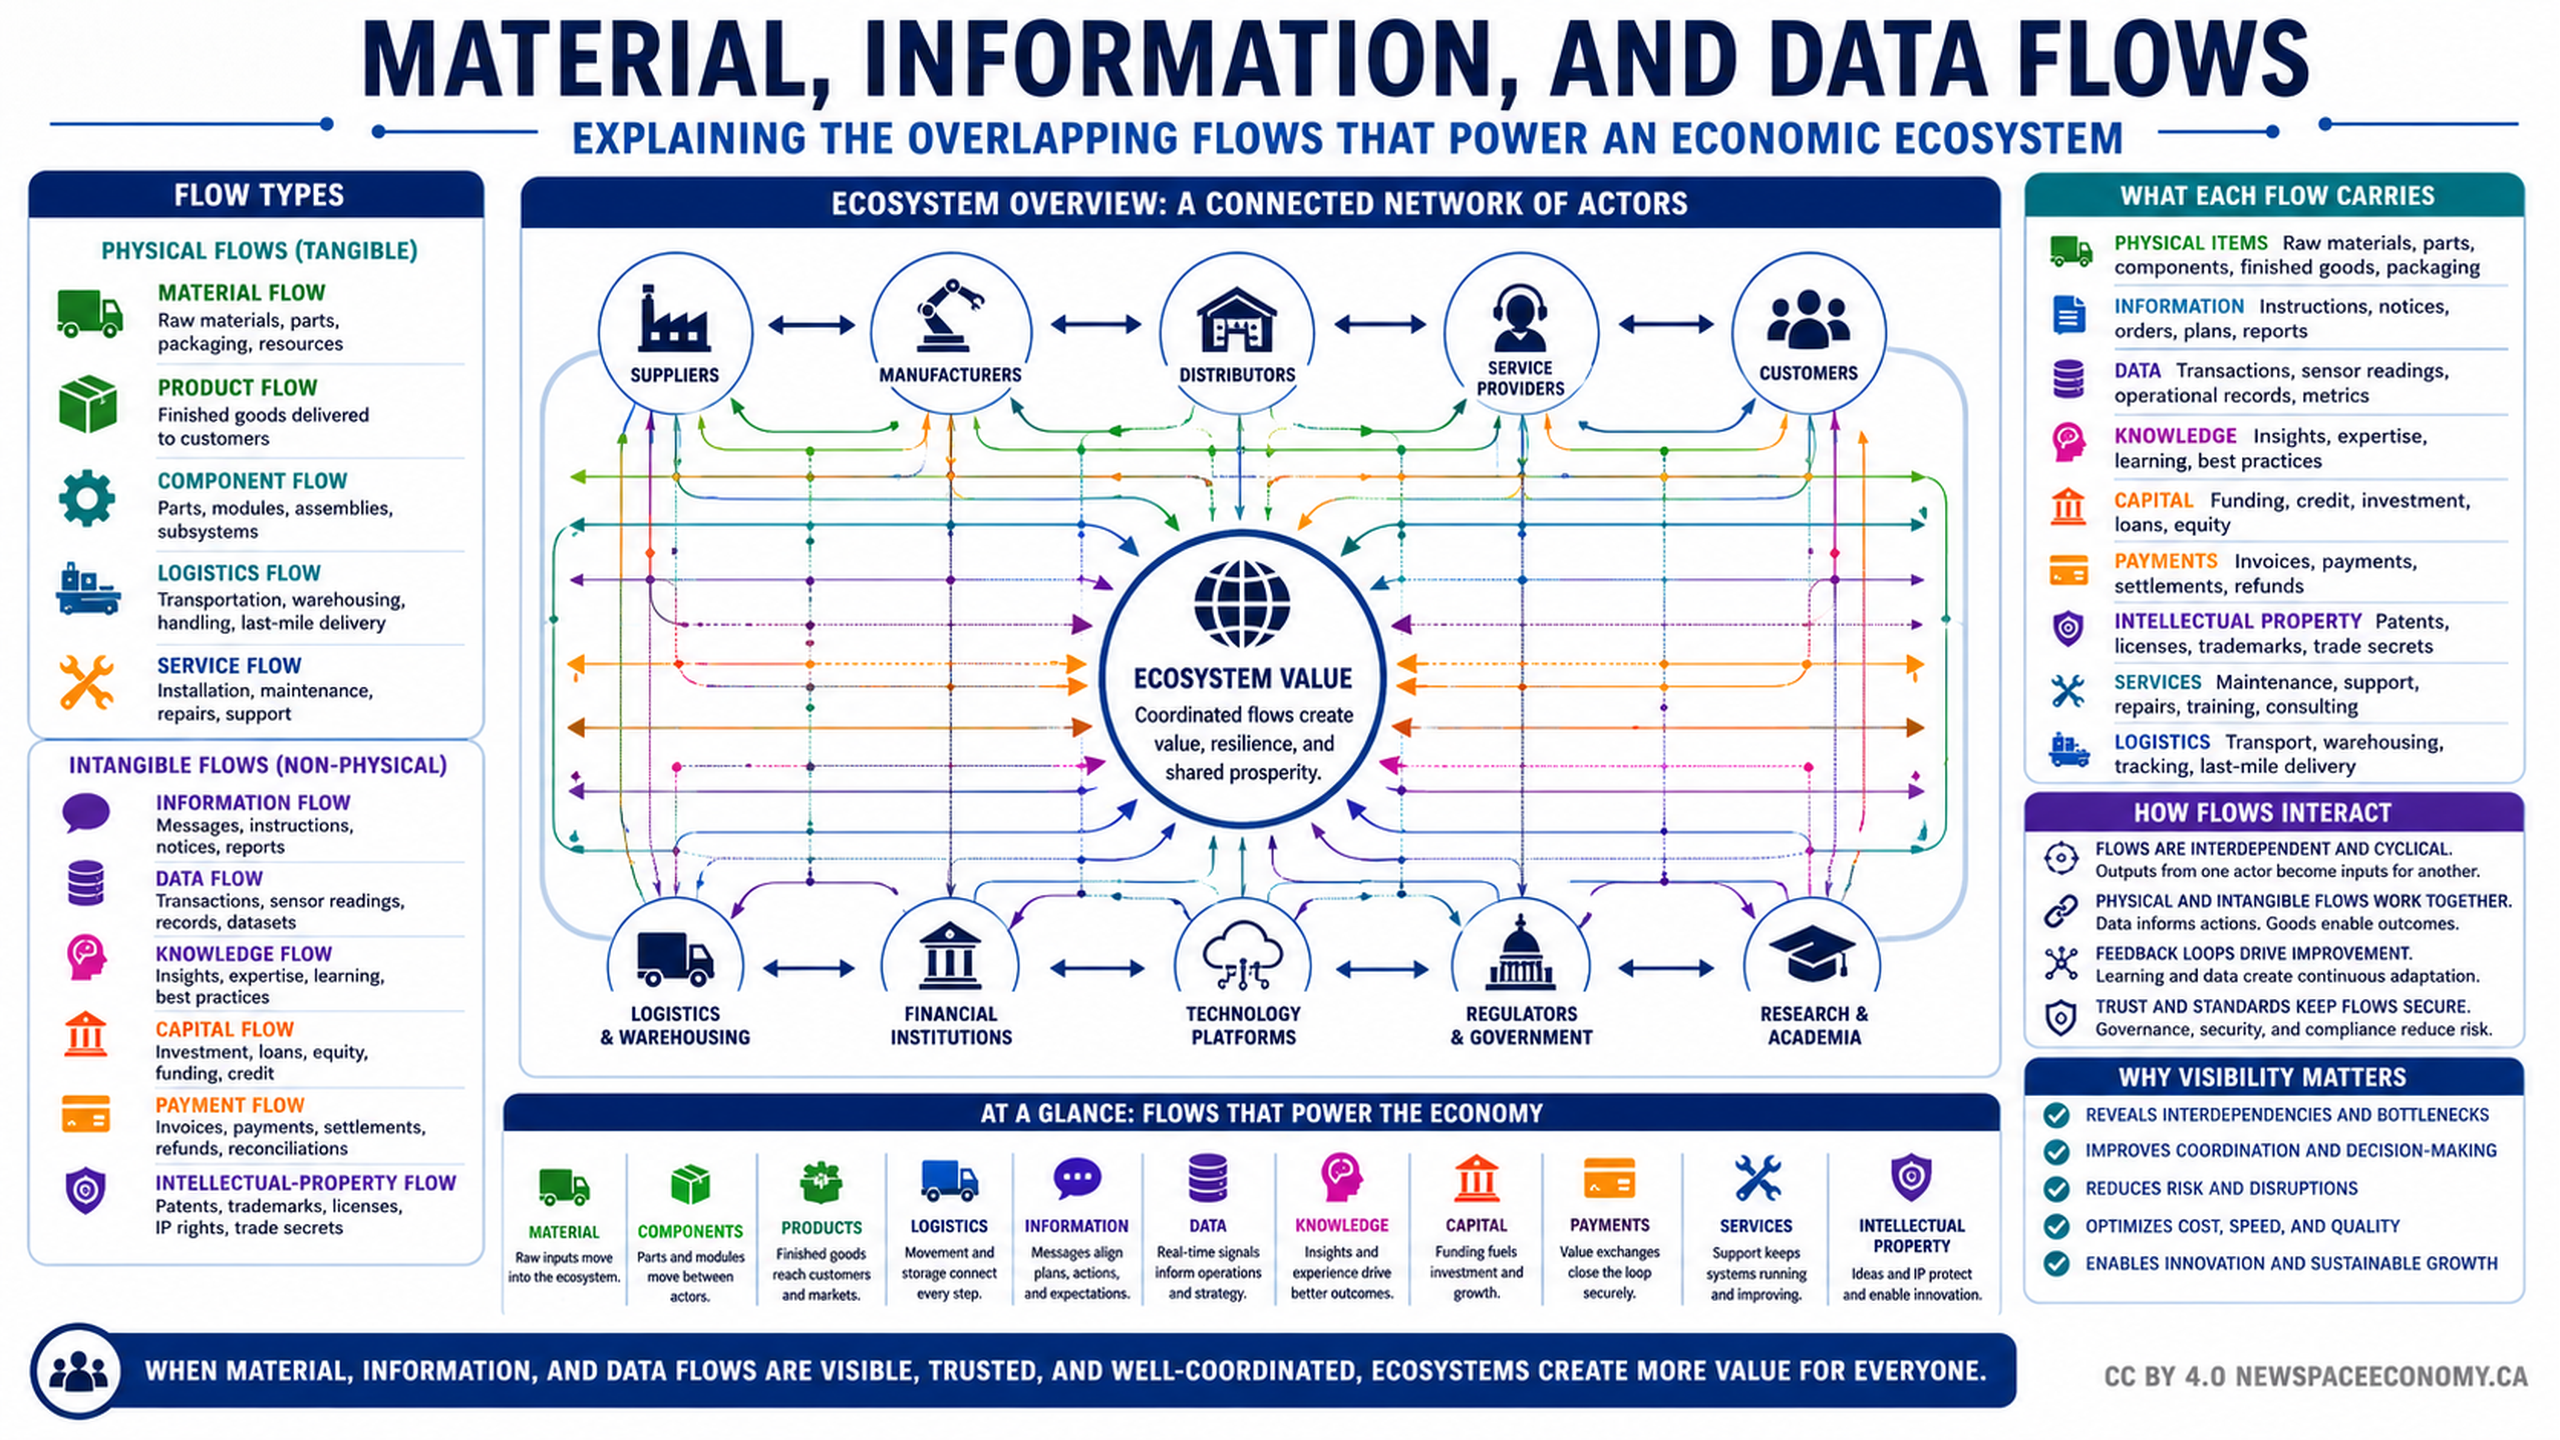
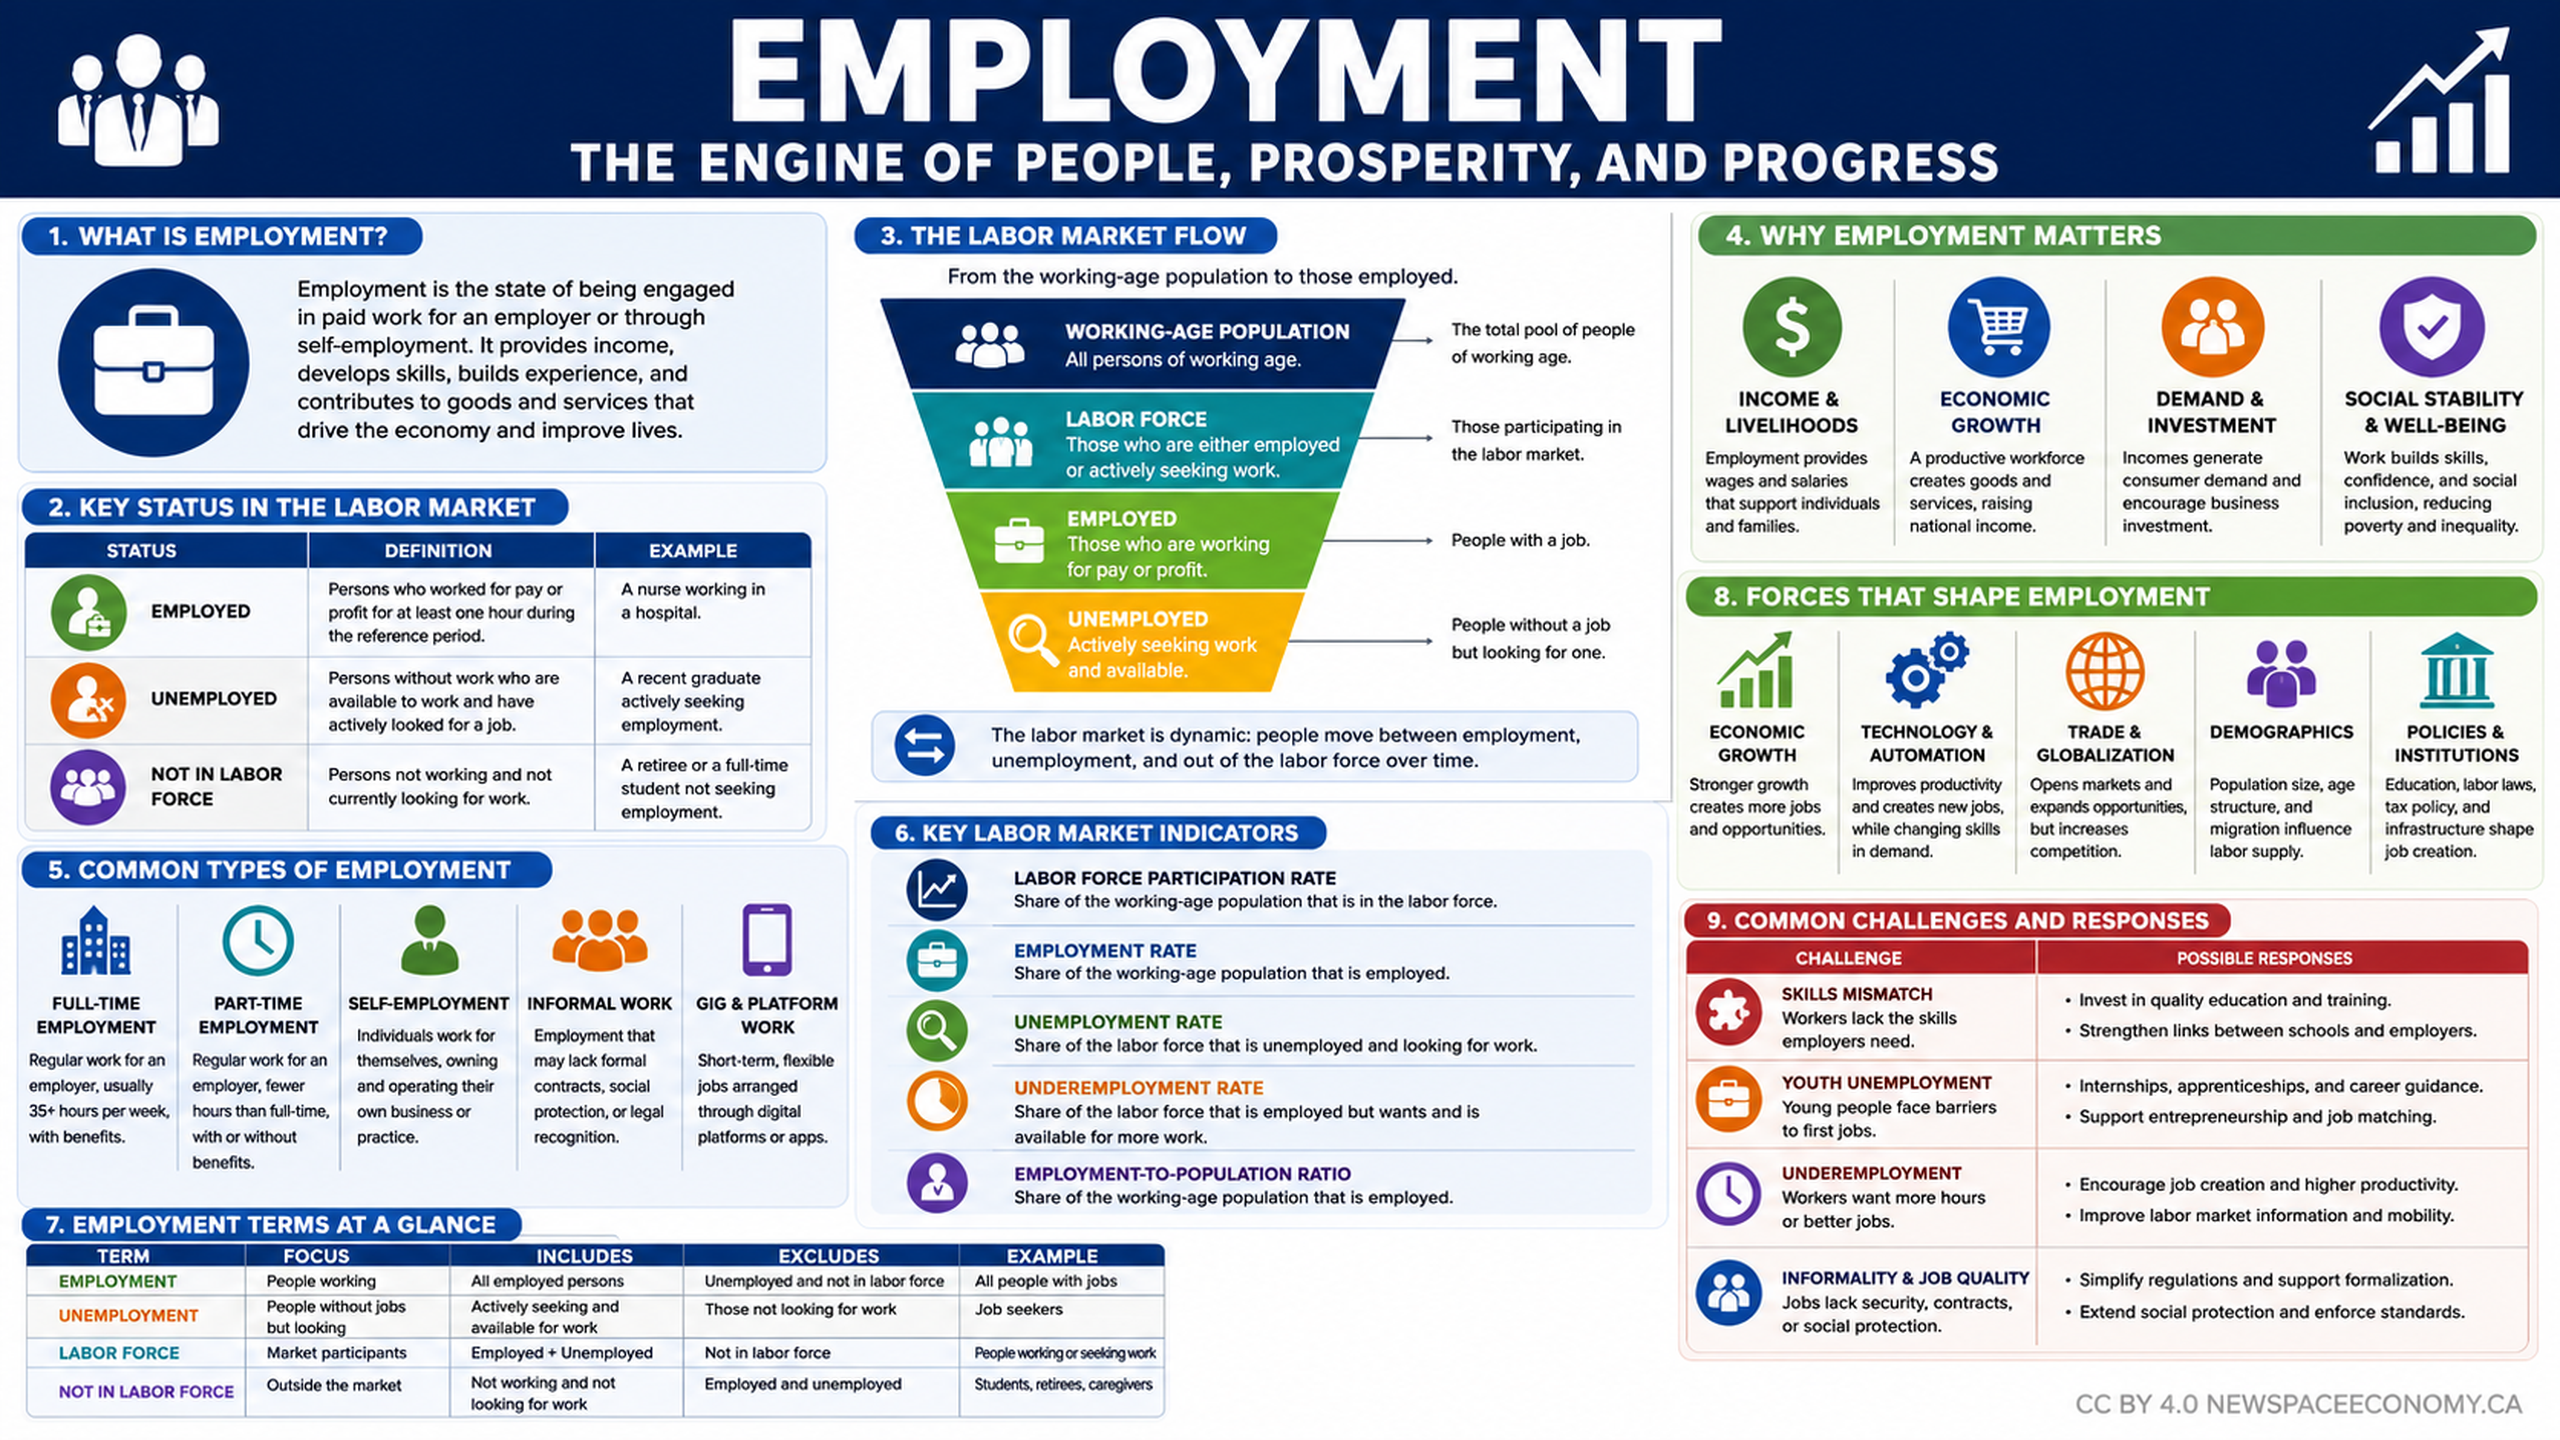
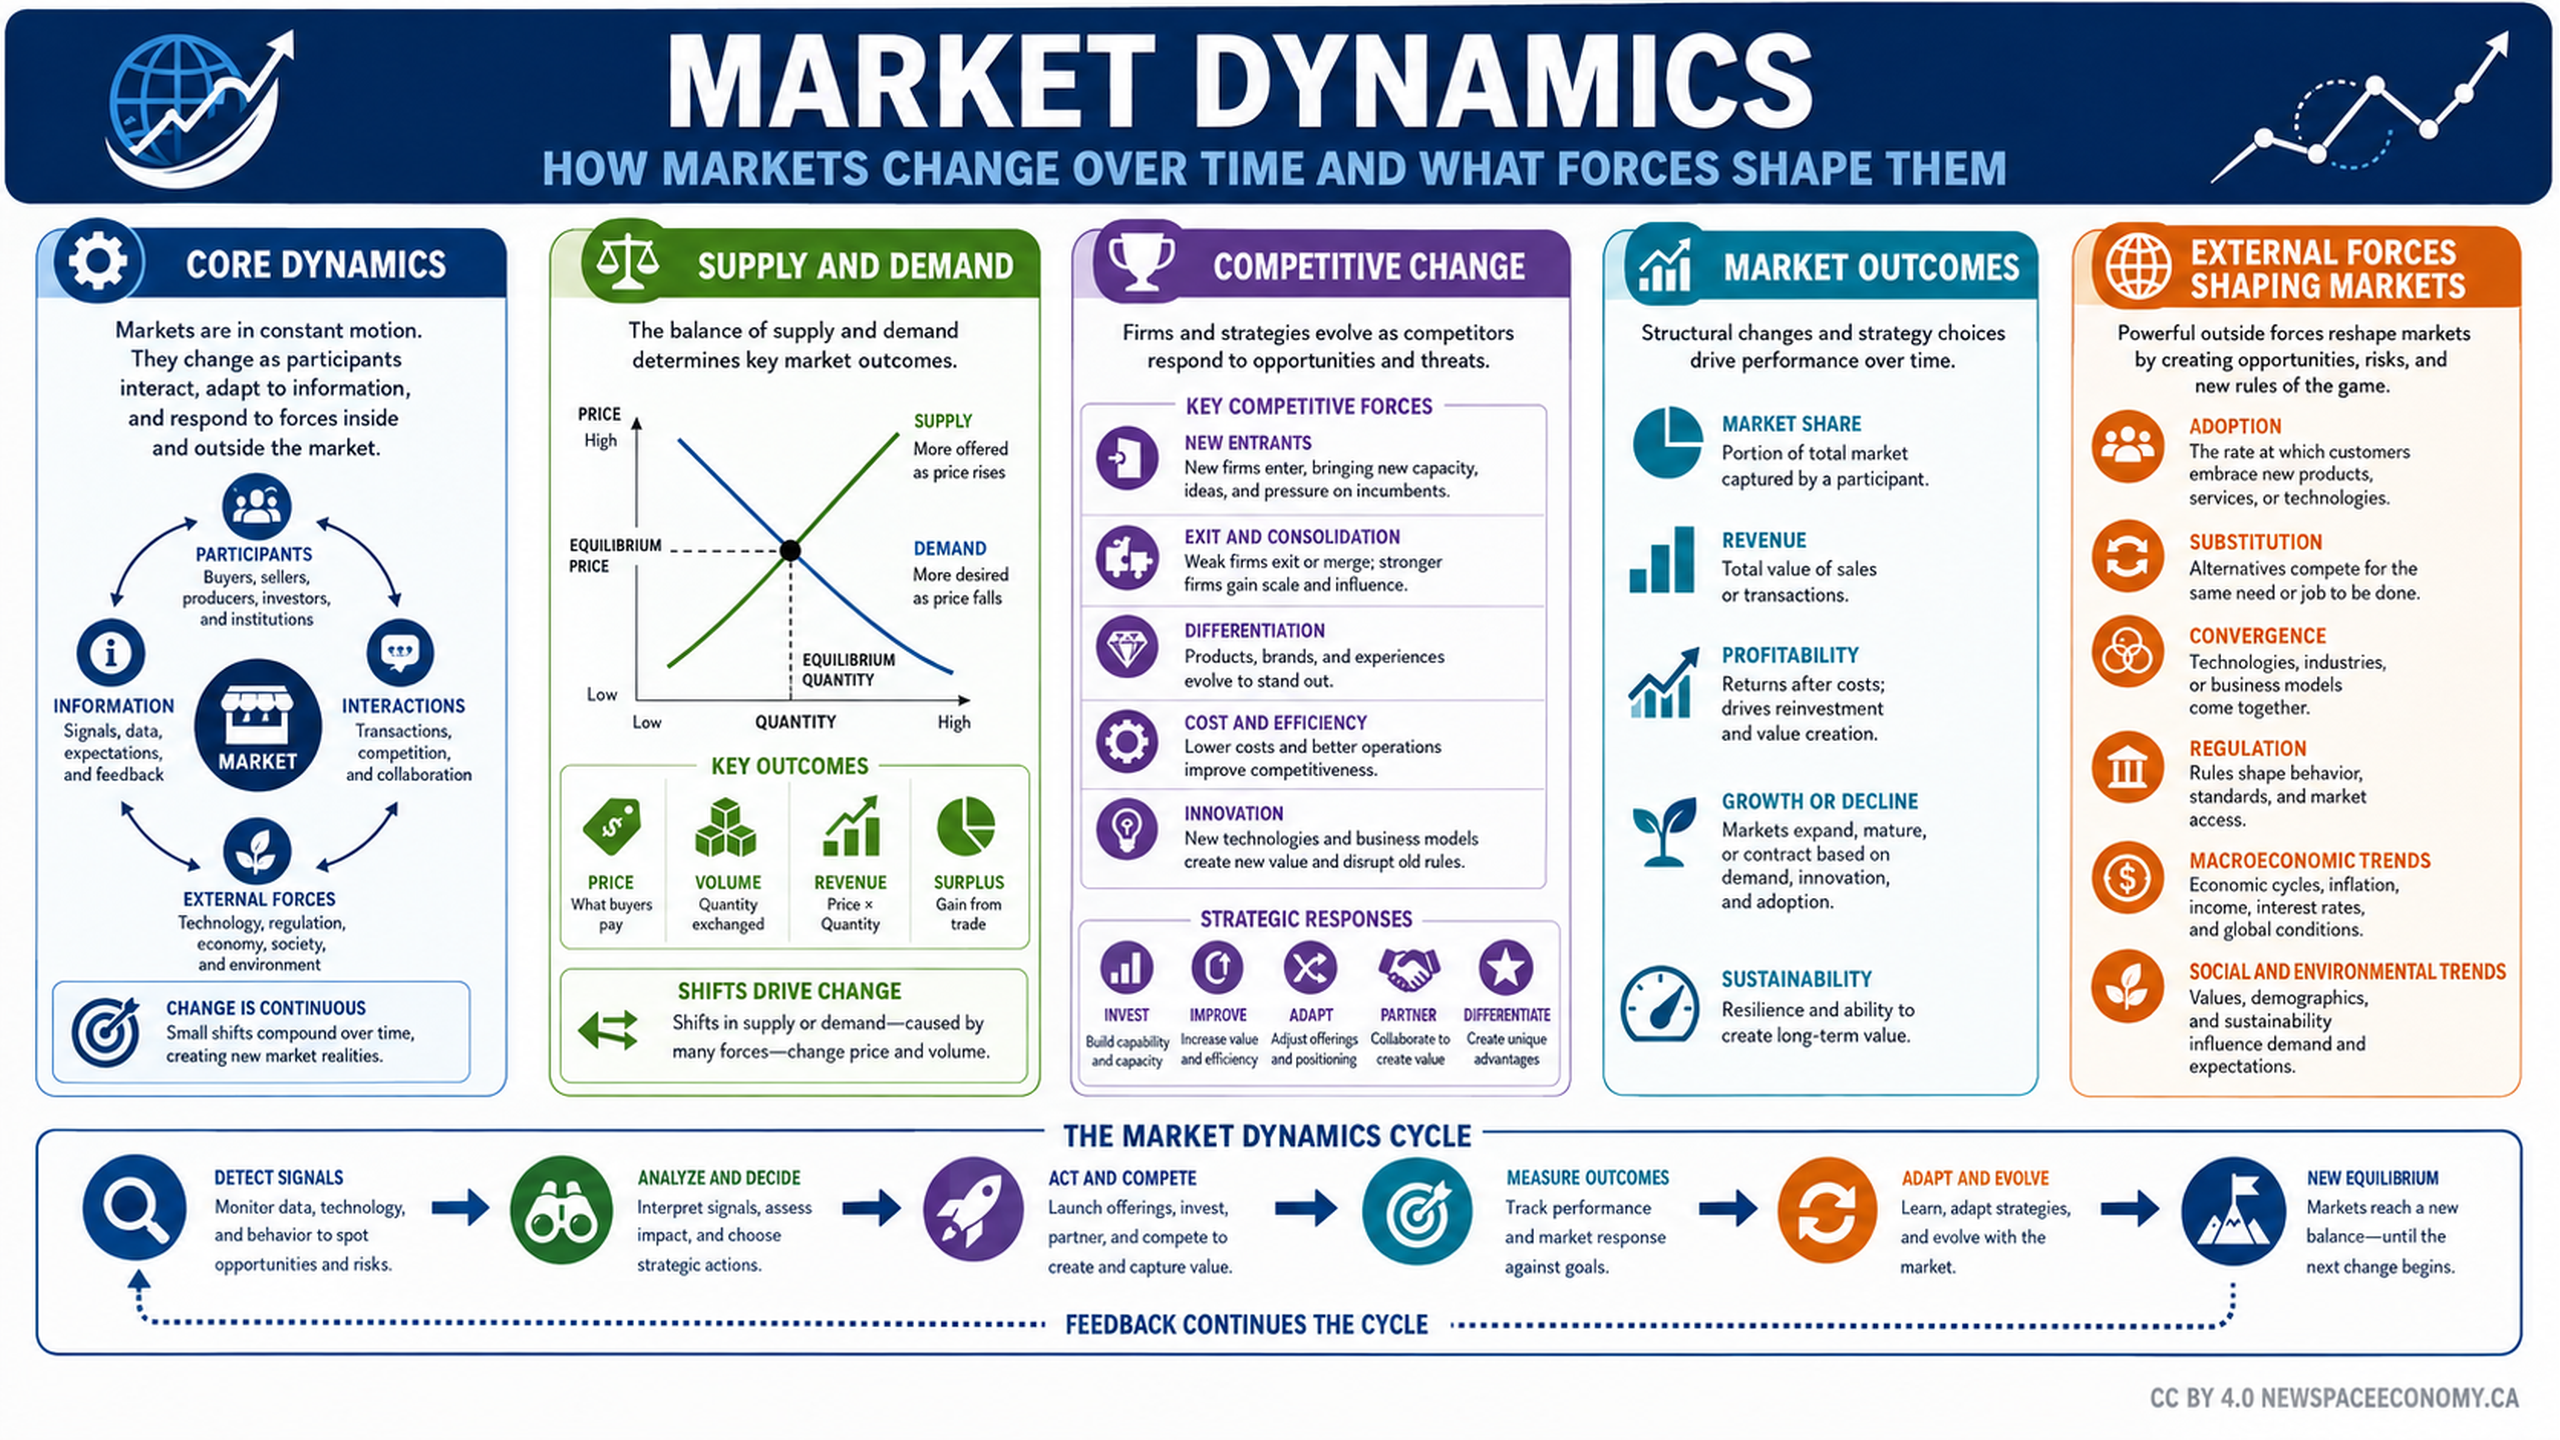
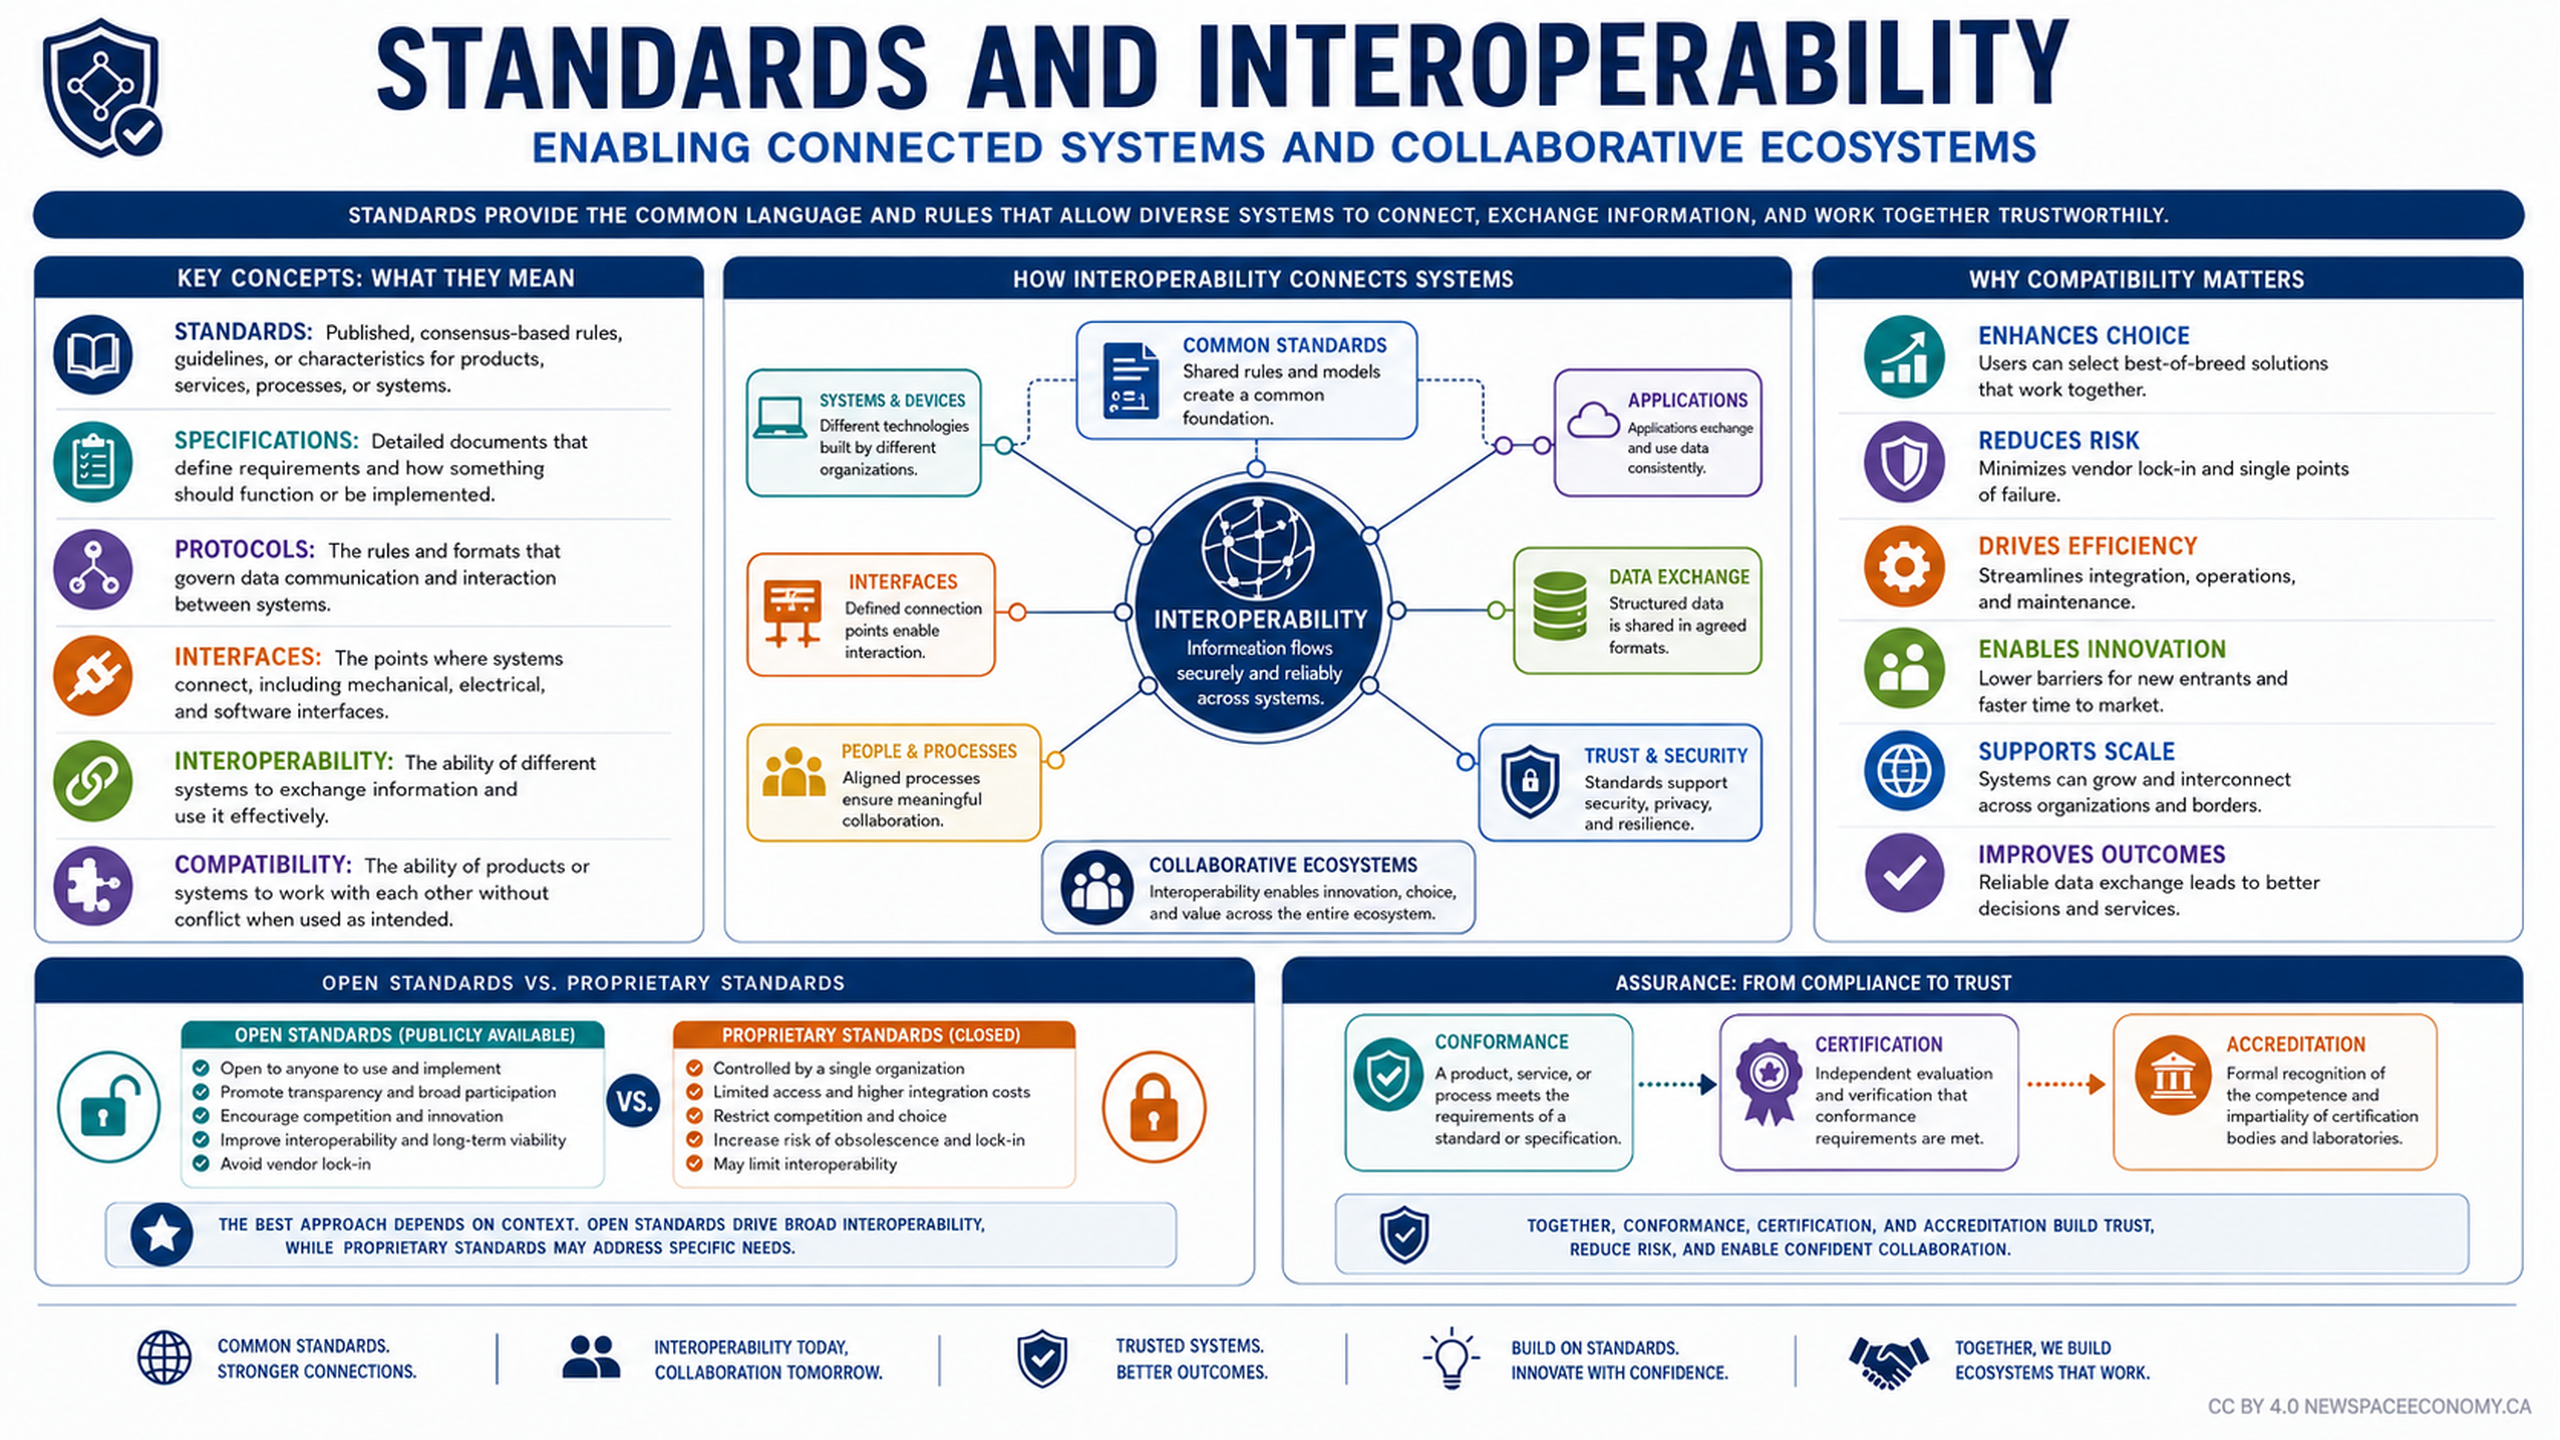
A structured educational infographic explains how resources move from savings and financial intermediation toward productive capacity, innovation, future income, and wider prosperity. It also compares direct asset creation with financial claims and outlines risk, time horizon, public and private activity, and key decision factors.

More From This Group