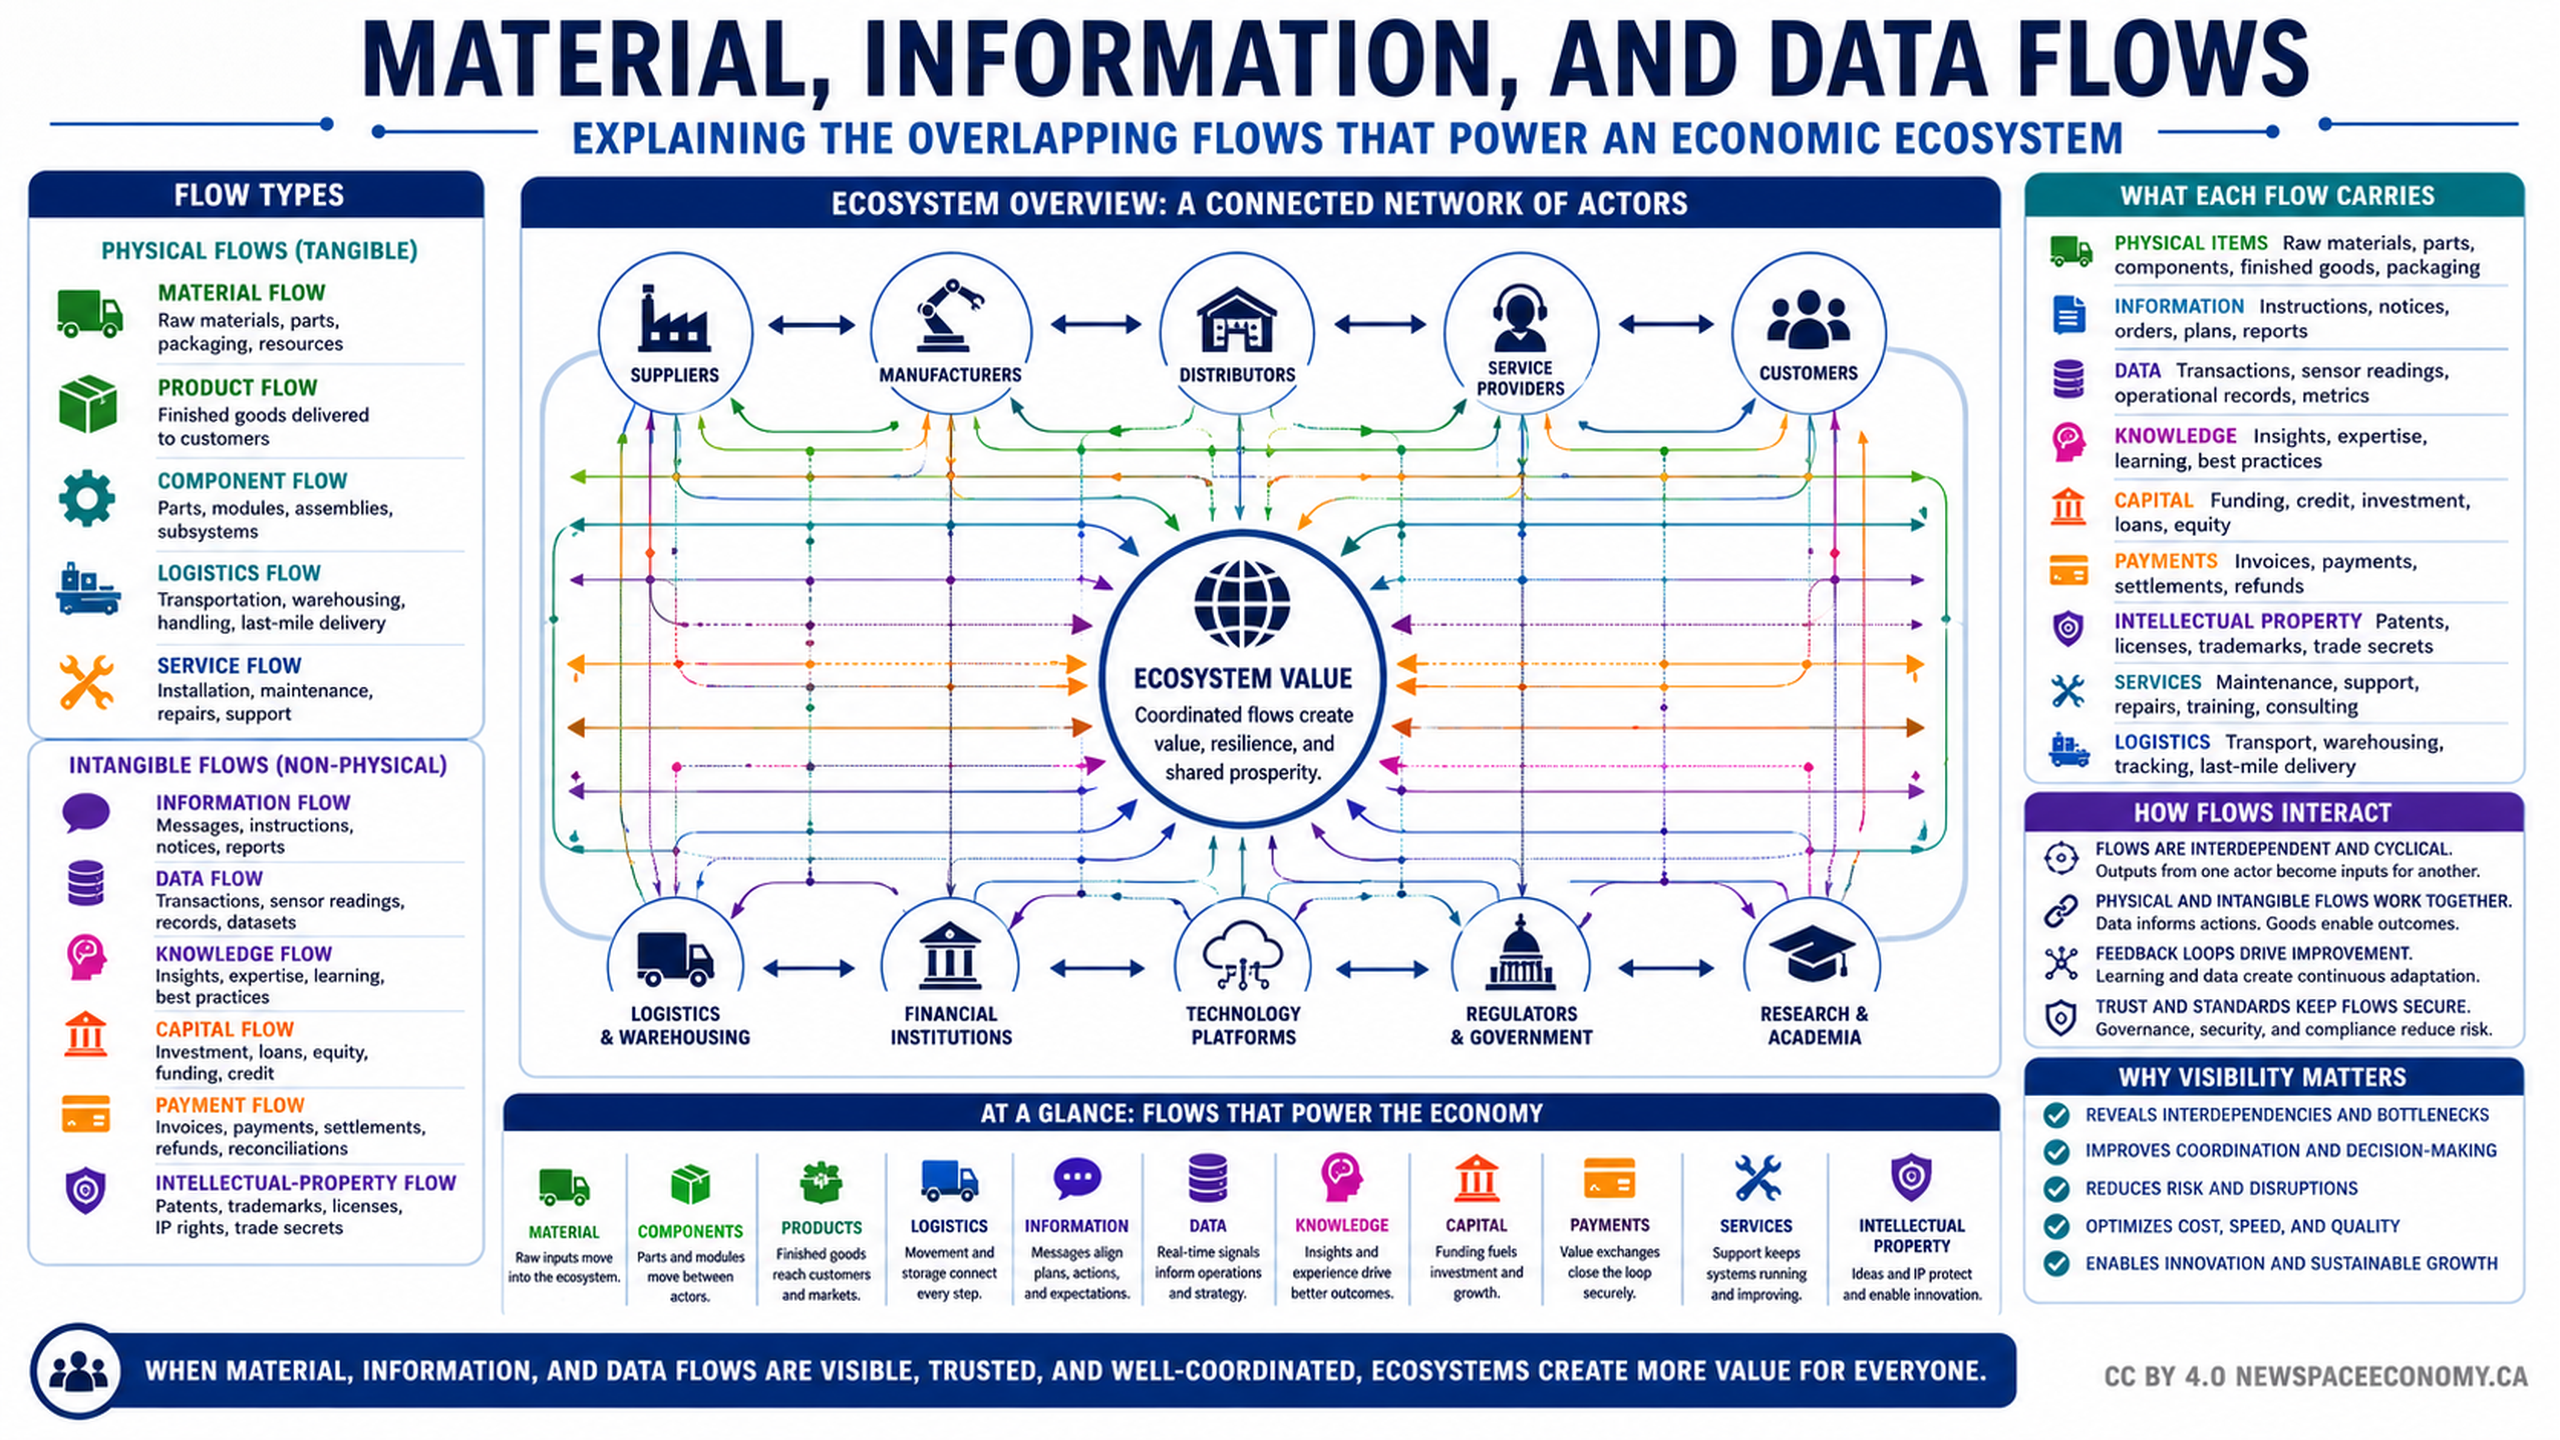
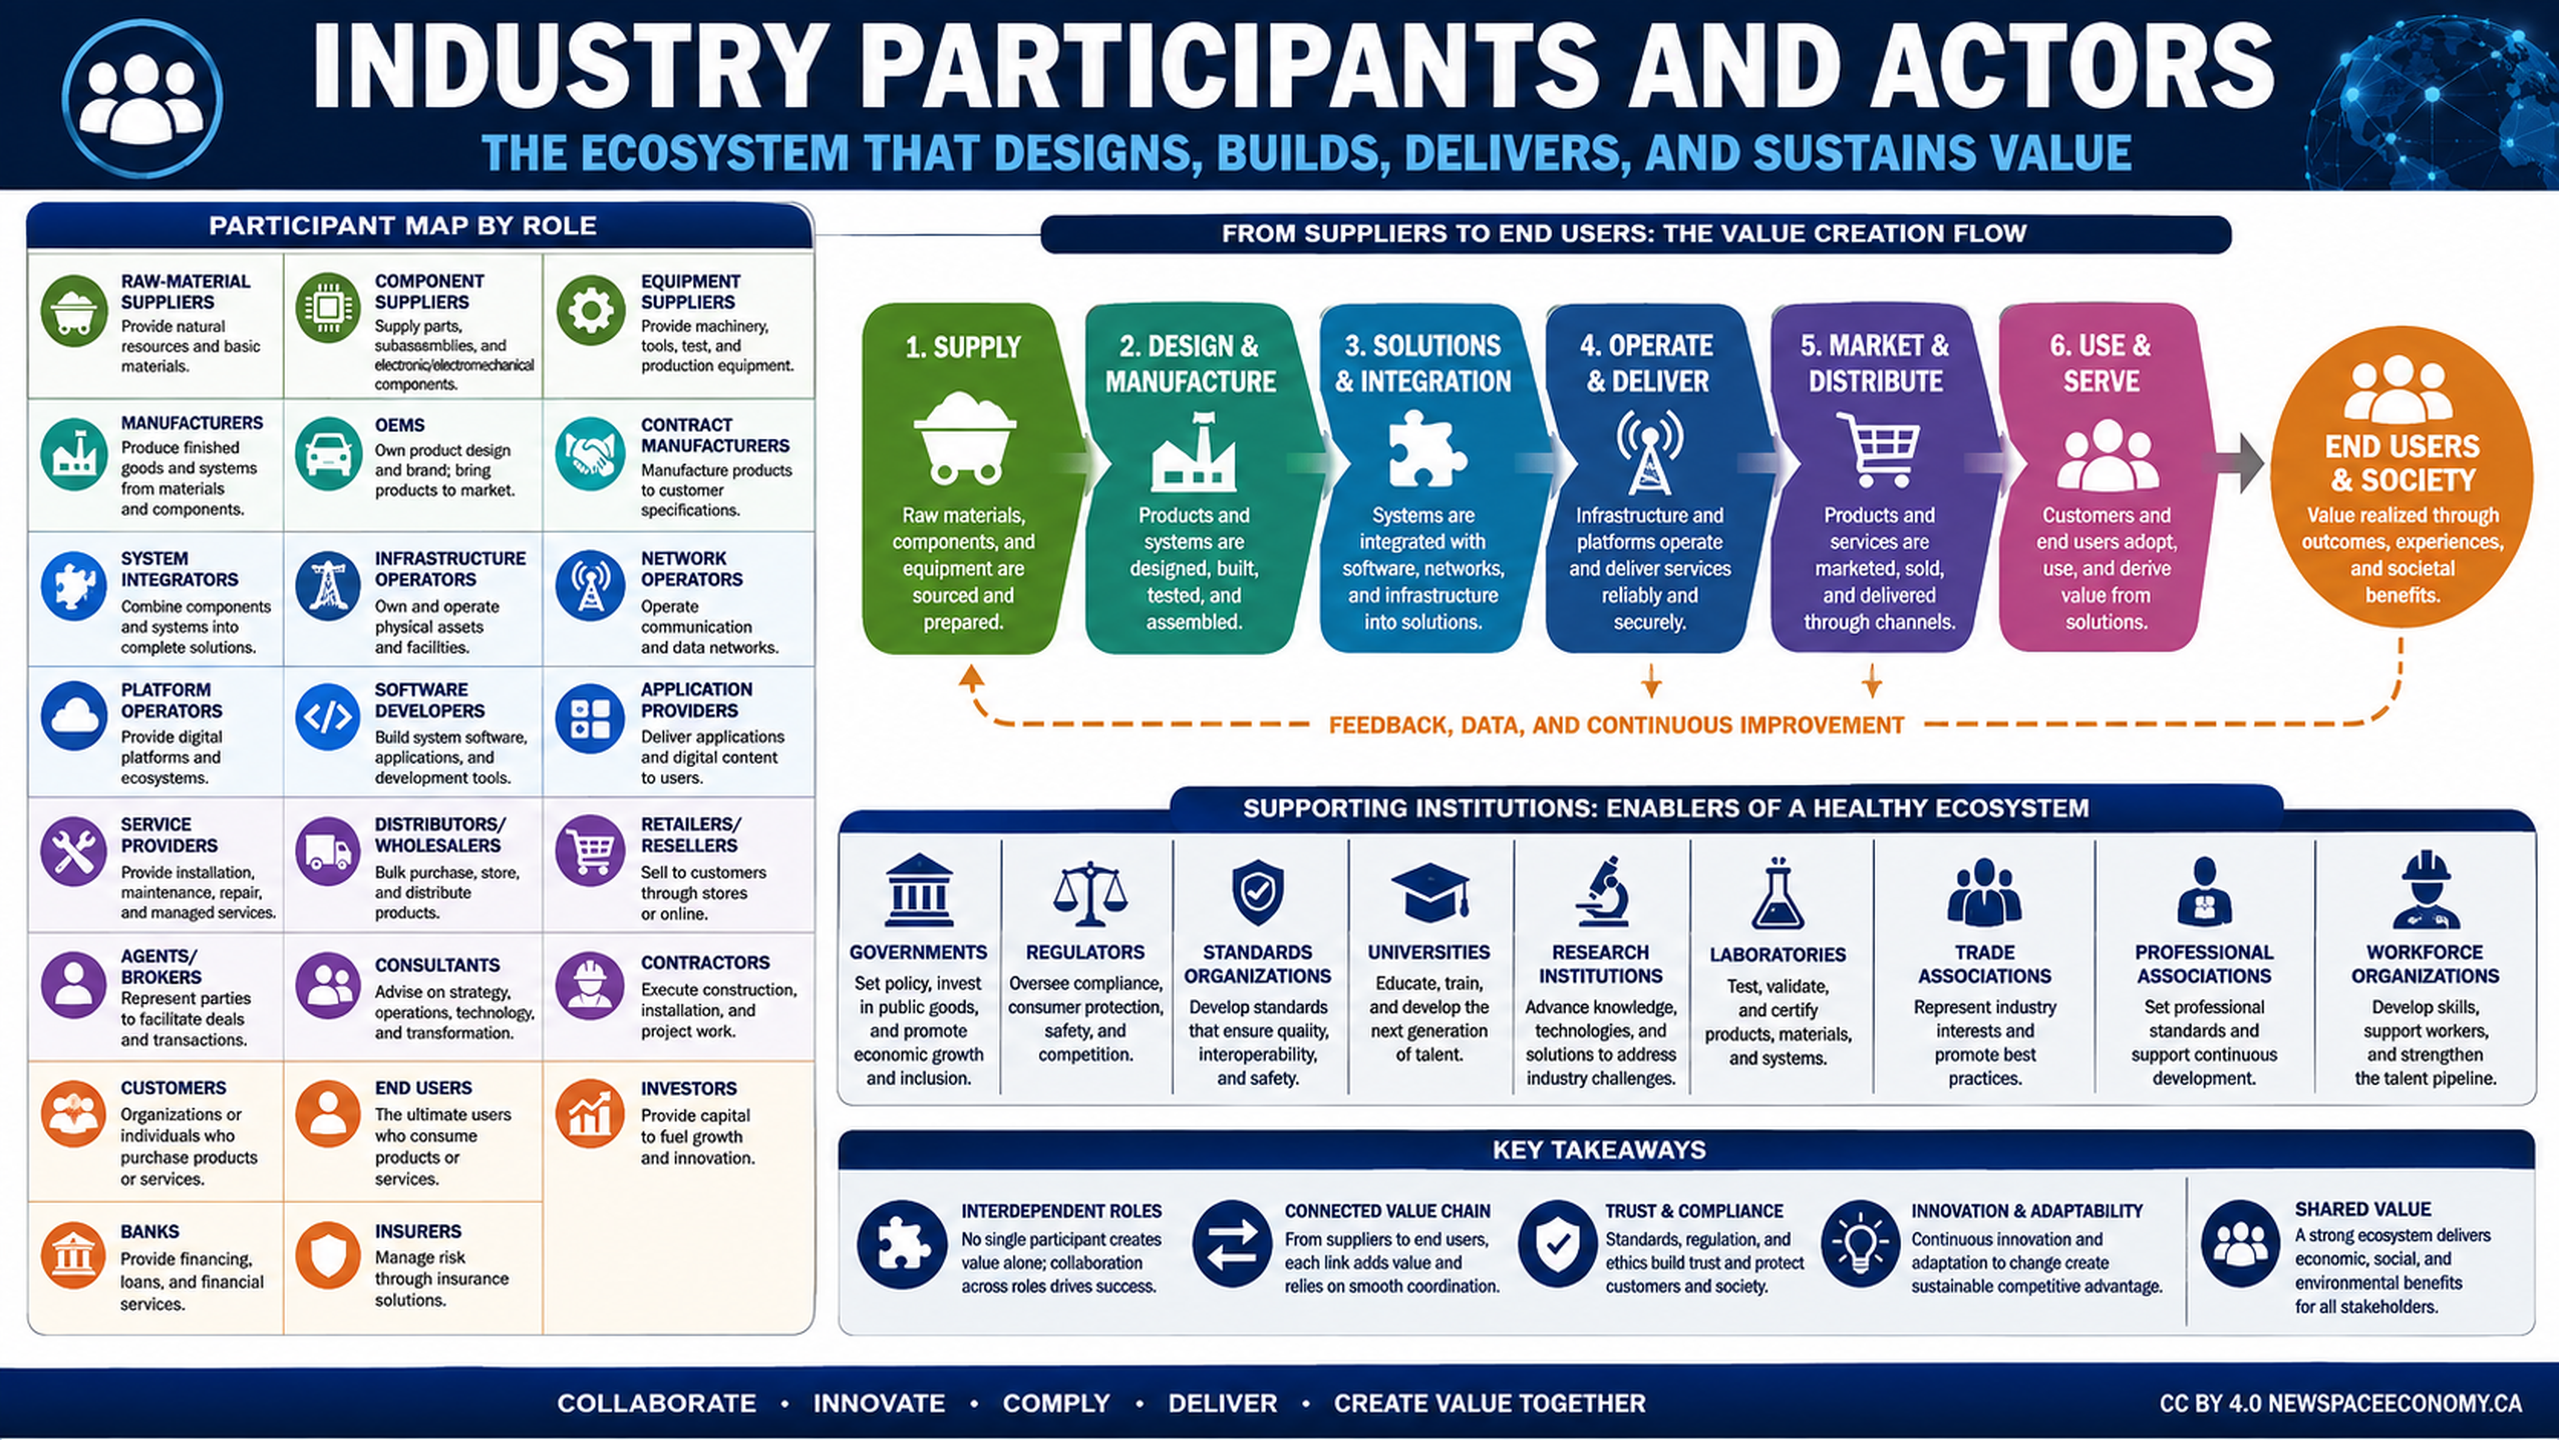
An infographic maps the organizations and roles involved in creating, delivering, using, and sustaining value across an industry ecosystem. It includes a participant map, a six-stage value-creation flow, supporting institutions, feedback and continuous improvement, and five key takeaways about collaboration and shared benefits.
More From This Group