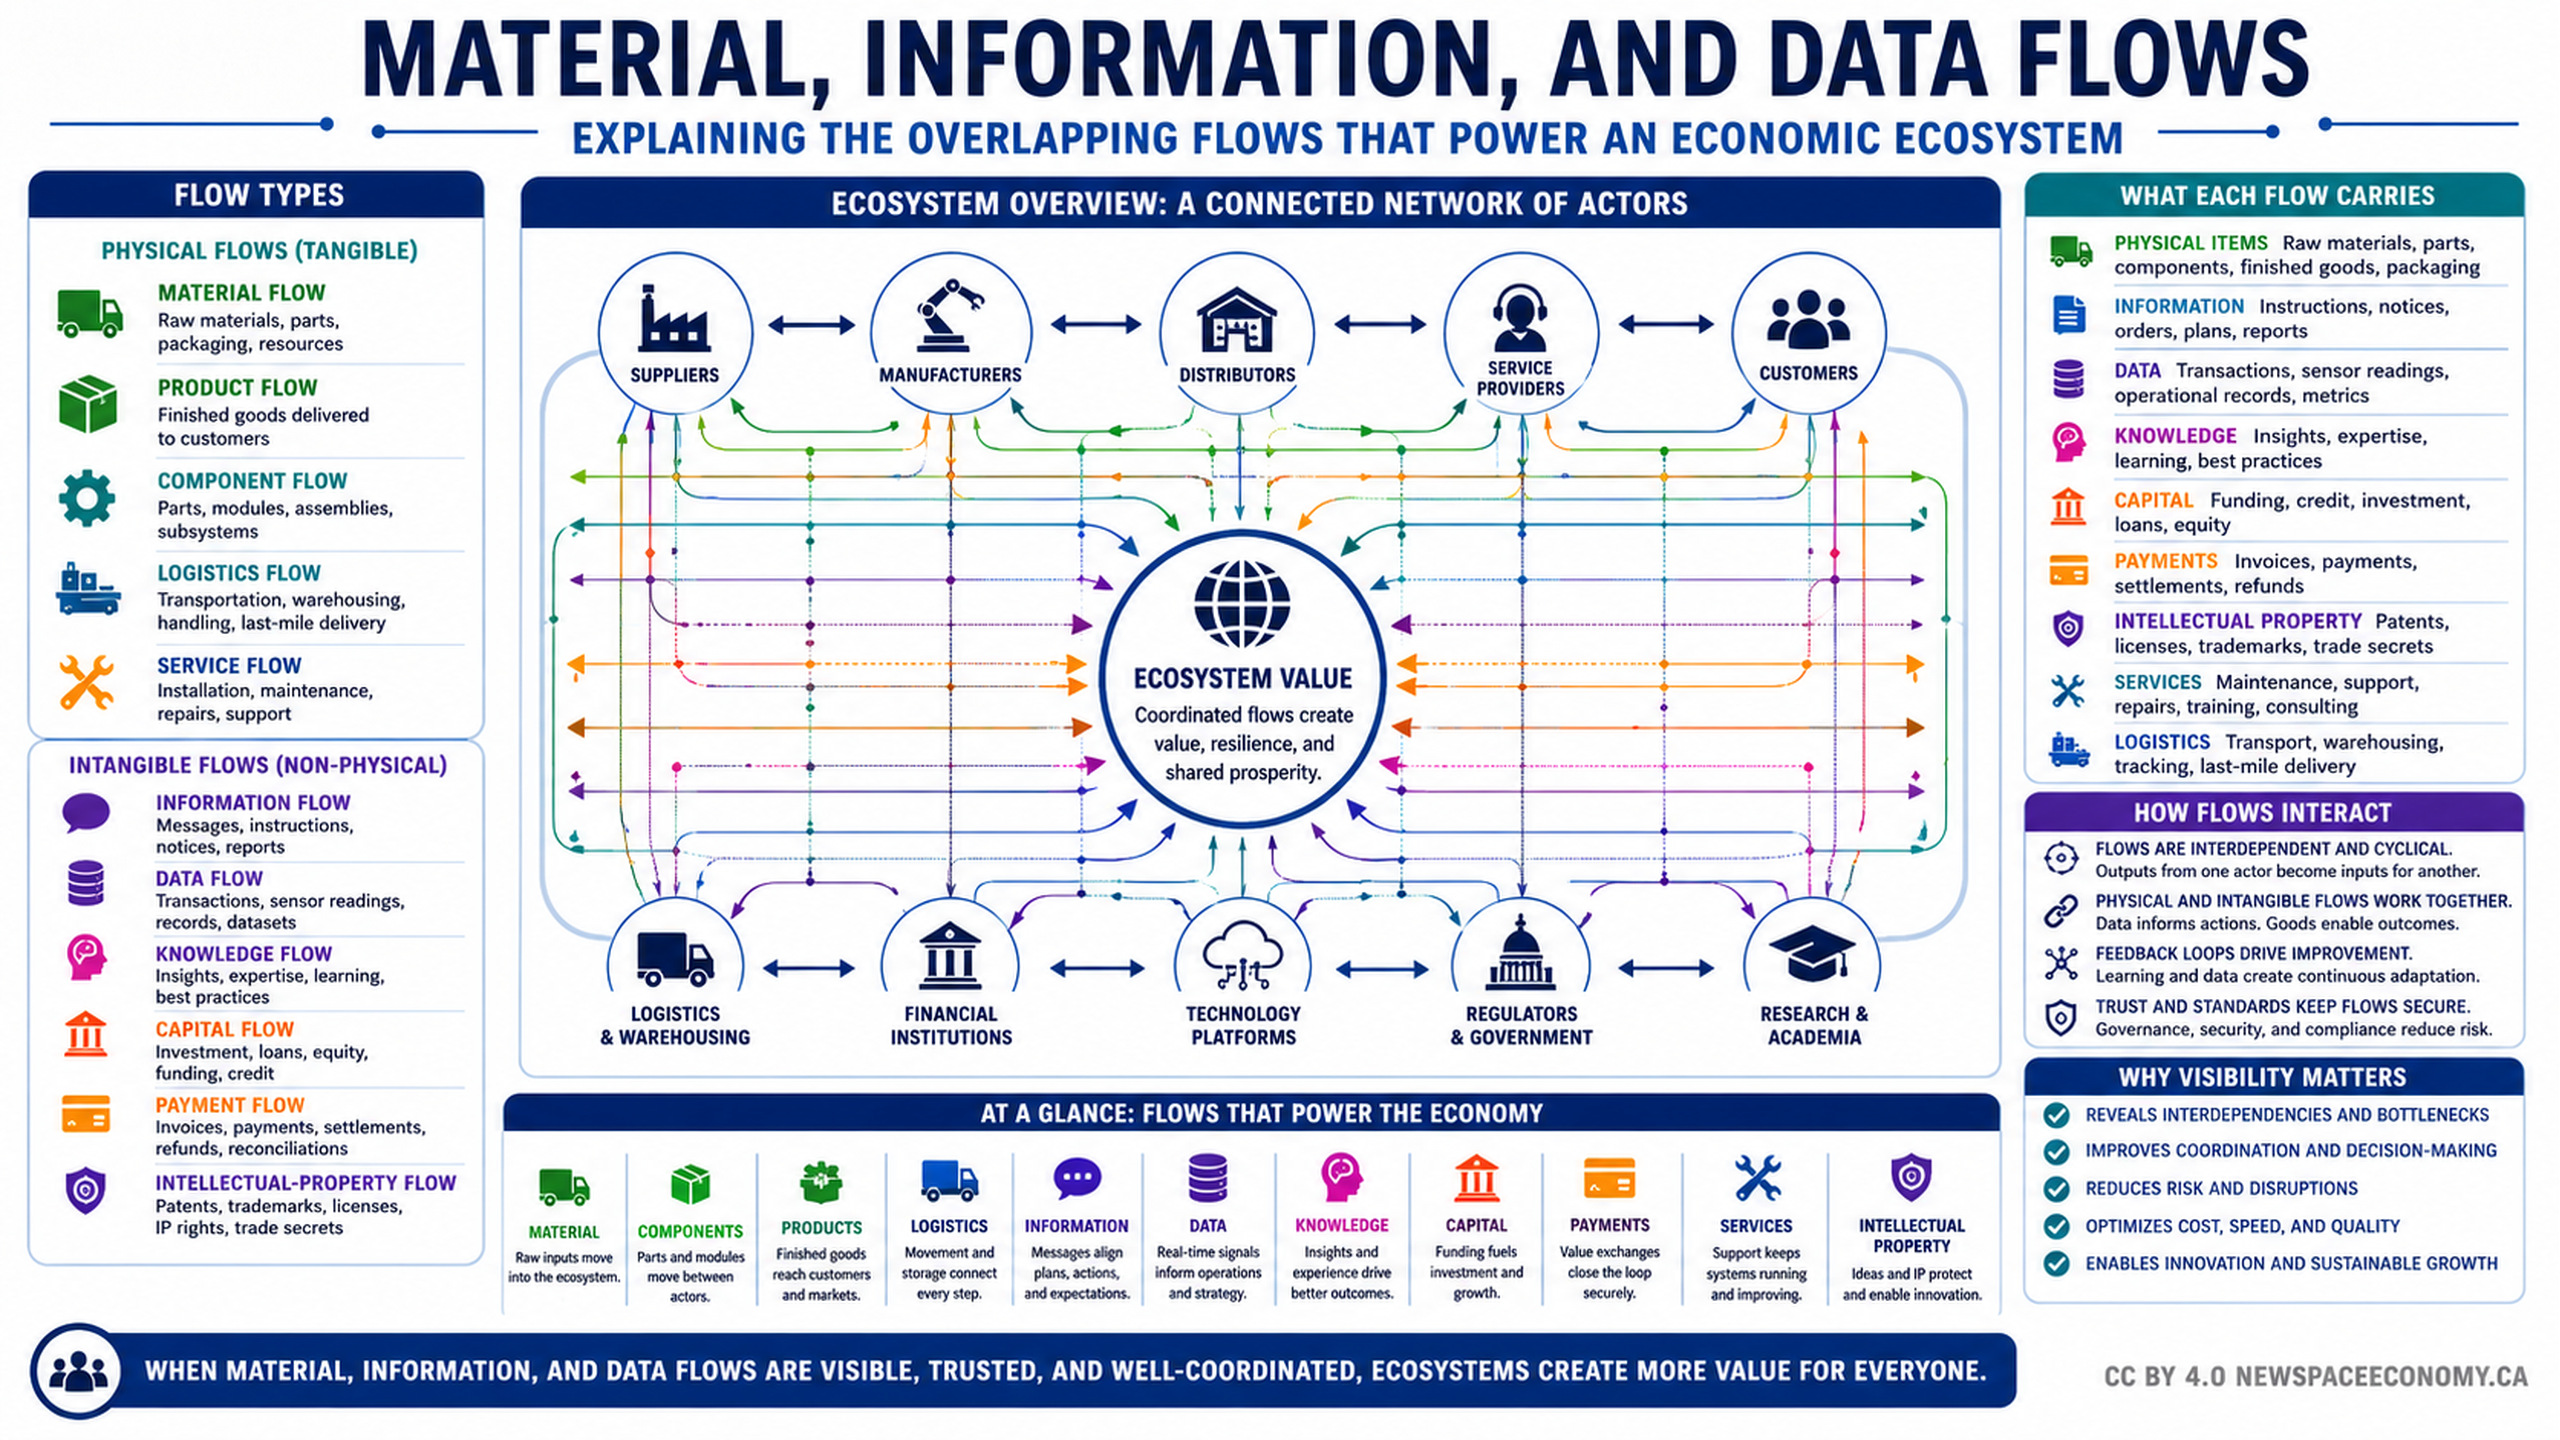
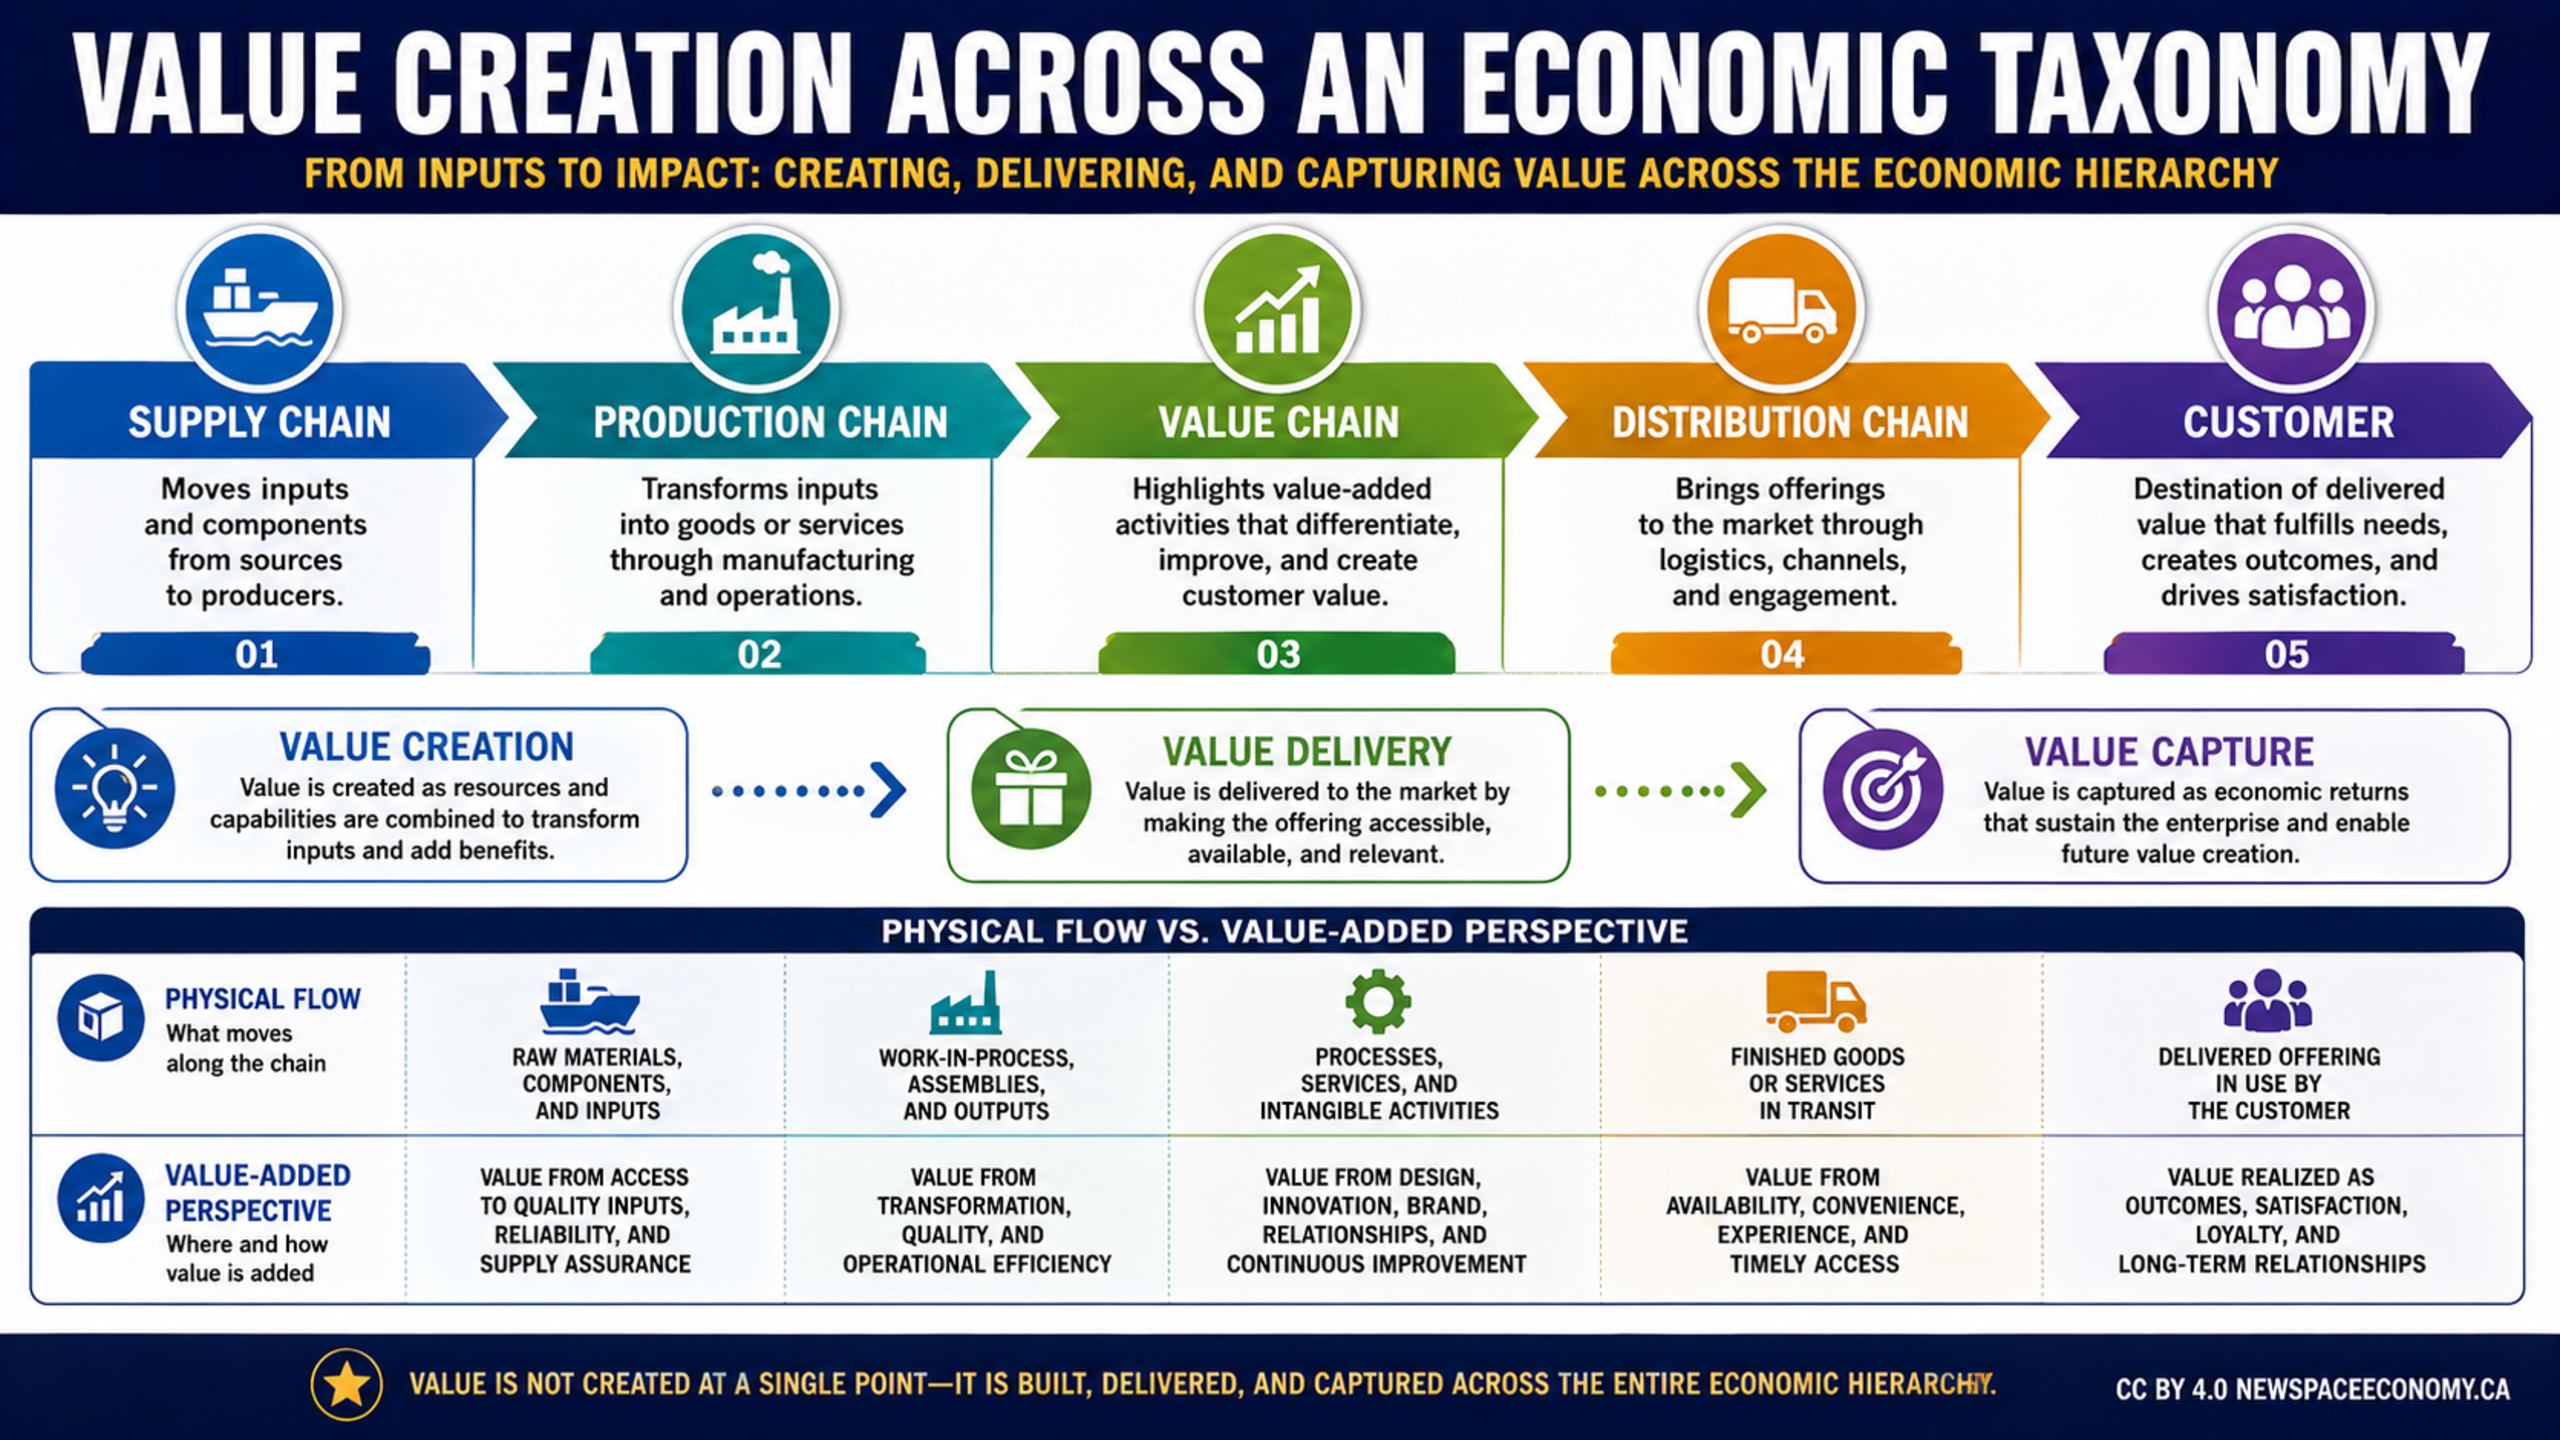
An infographic explains the progression from inputs and components through production, value-added activities, distribution, and customer outcomes. It also distinguishes physical flow from value-added perspectives and separates value creation, value delivery, and value capture.
More From This Group