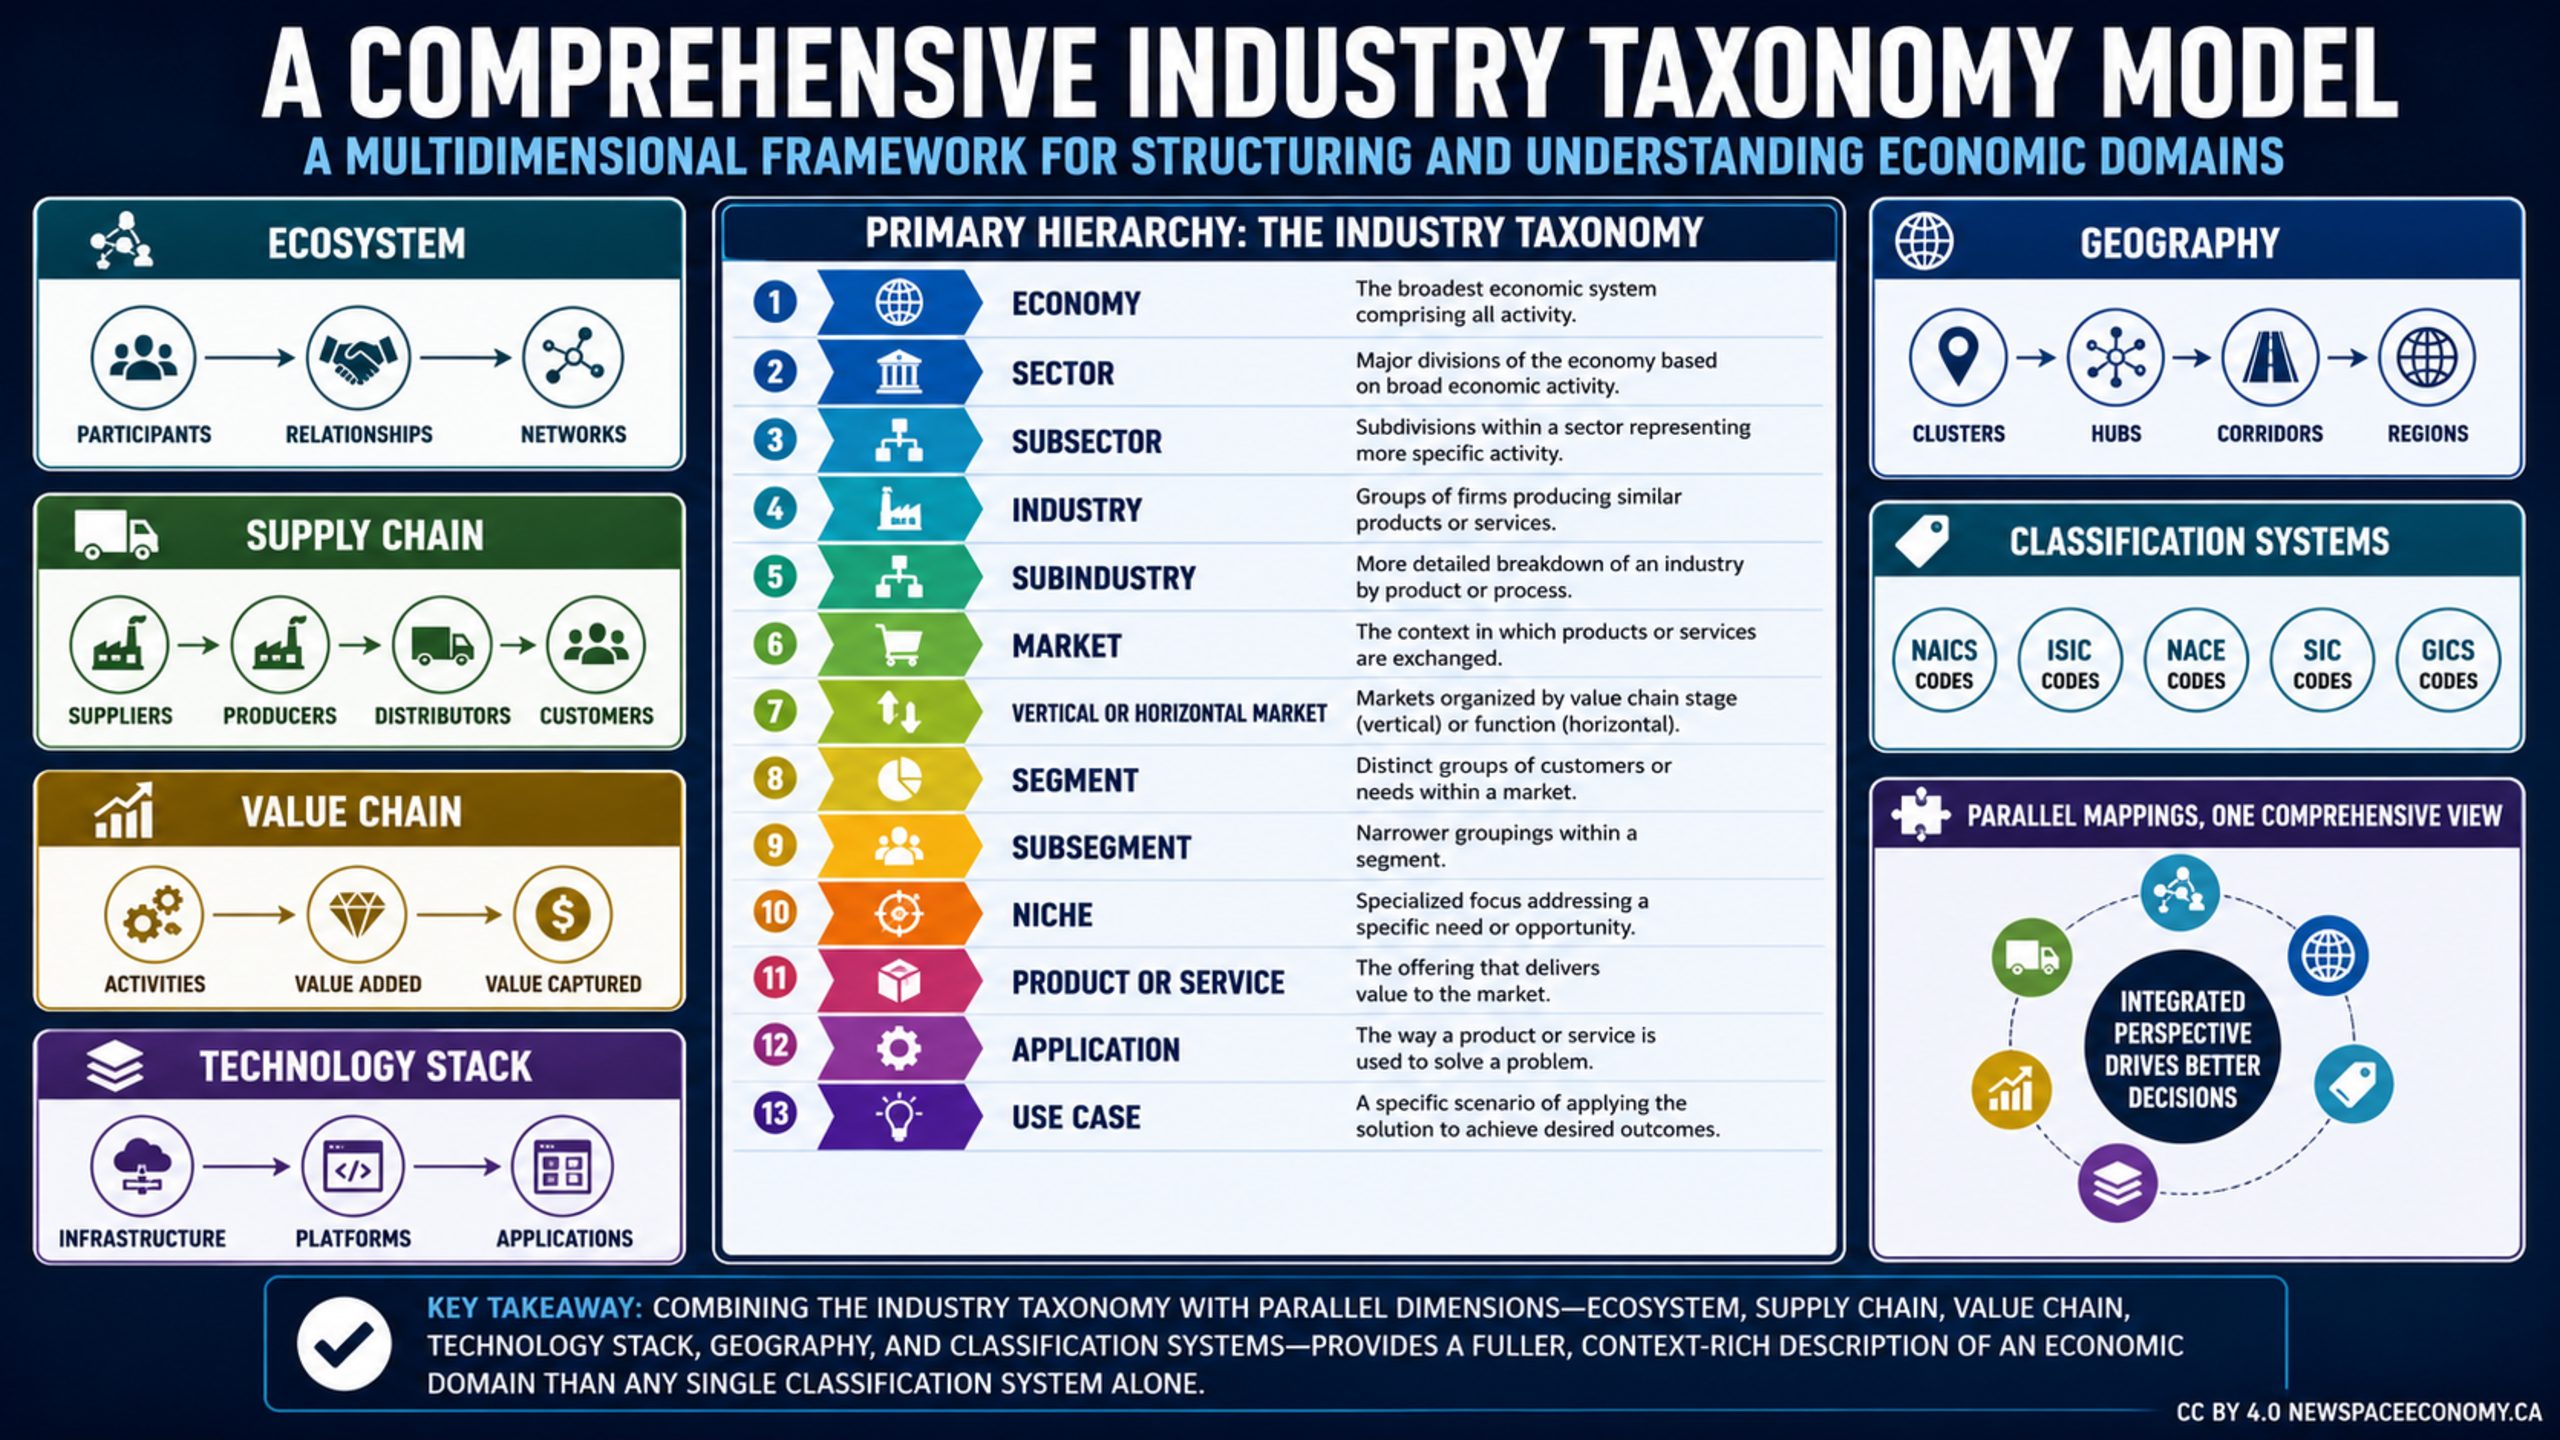
An infographic explains a layered framework for organizing economic activity, from broad economies and sectors to specific markets, products, applications, and use cases. It also maps related perspectives including ecosystems, supply chains, value chains, technology, geography, and classification systems.
More From This Group