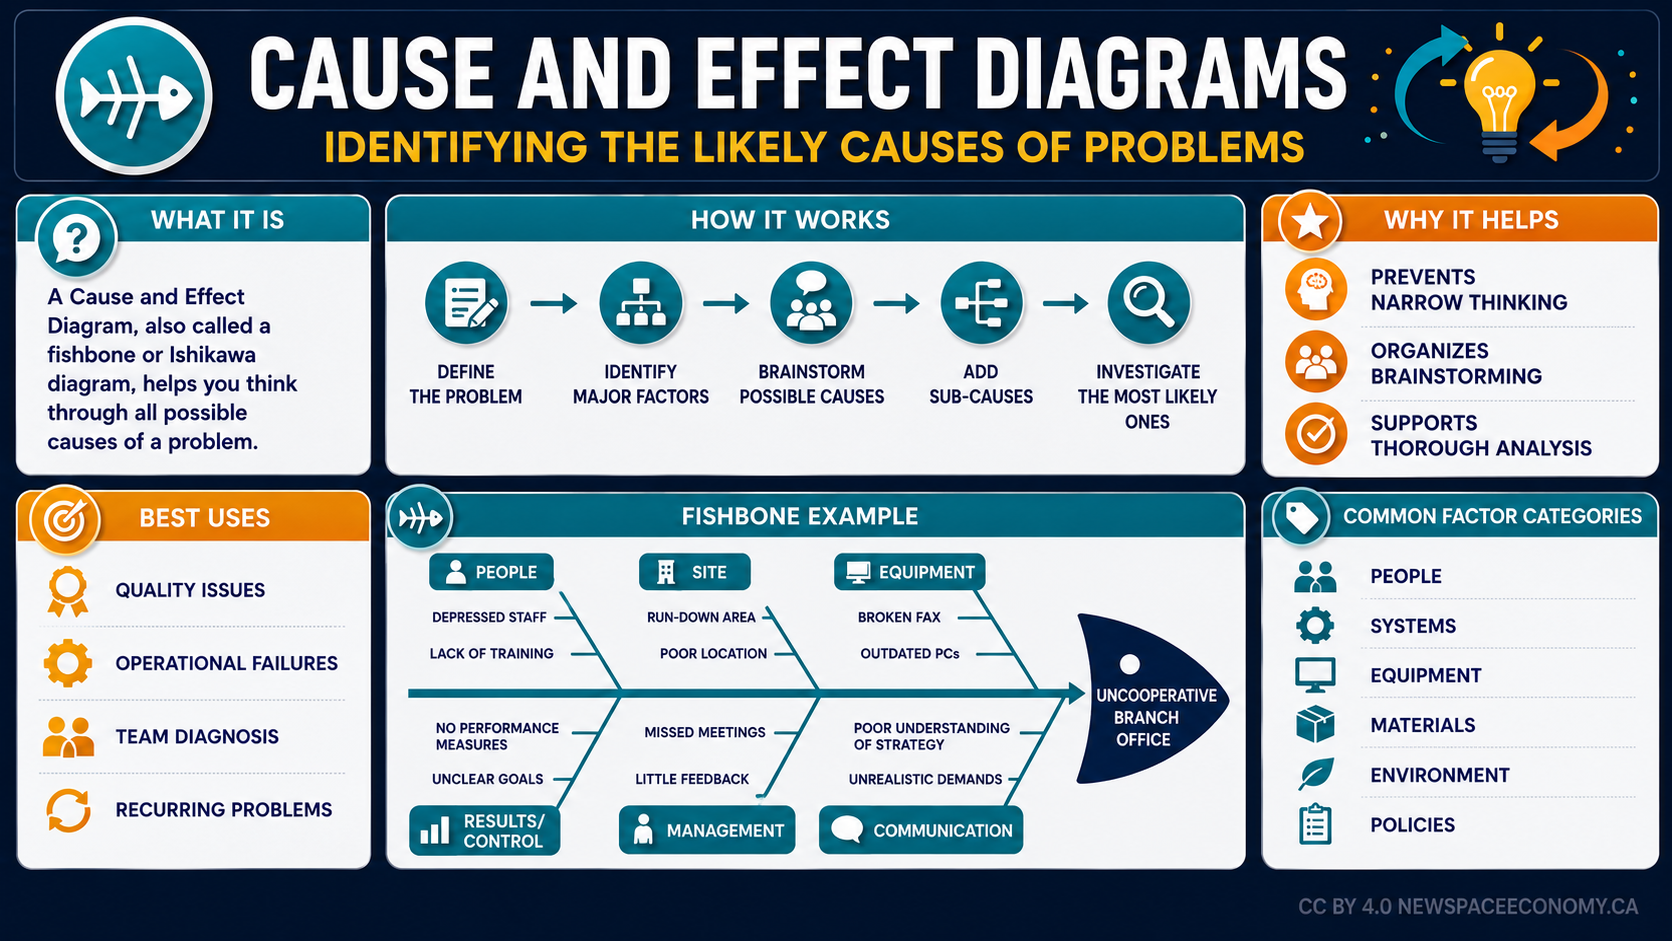
An instructional infographic explains how to use a fishbone or Ishikawa method to investigate the causes of a problem. It includes a step-by-step process, common factor categories, practical uses, and an example focused on an uncooperative branch office.
More From This Group