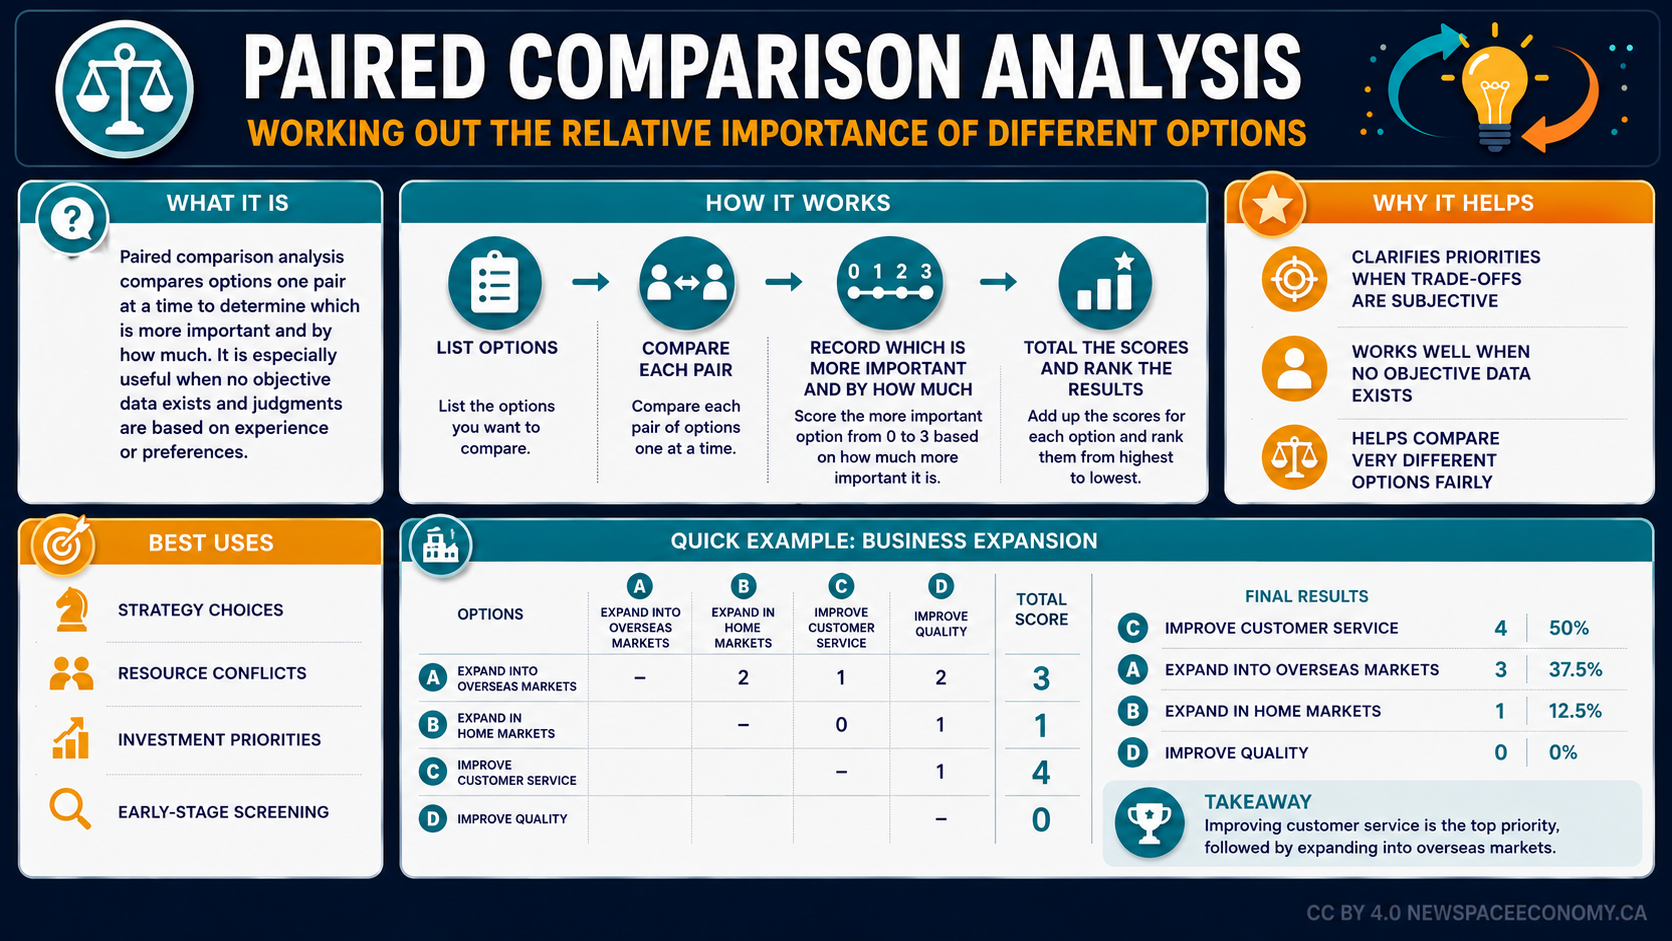
An infographic explains a structured method for comparing choices pair by pair and ranking them by weighted scores. A business expansion example places improving customer service first, followed by overseas expansion, home-market expansion, and improving quality.
More From This Group