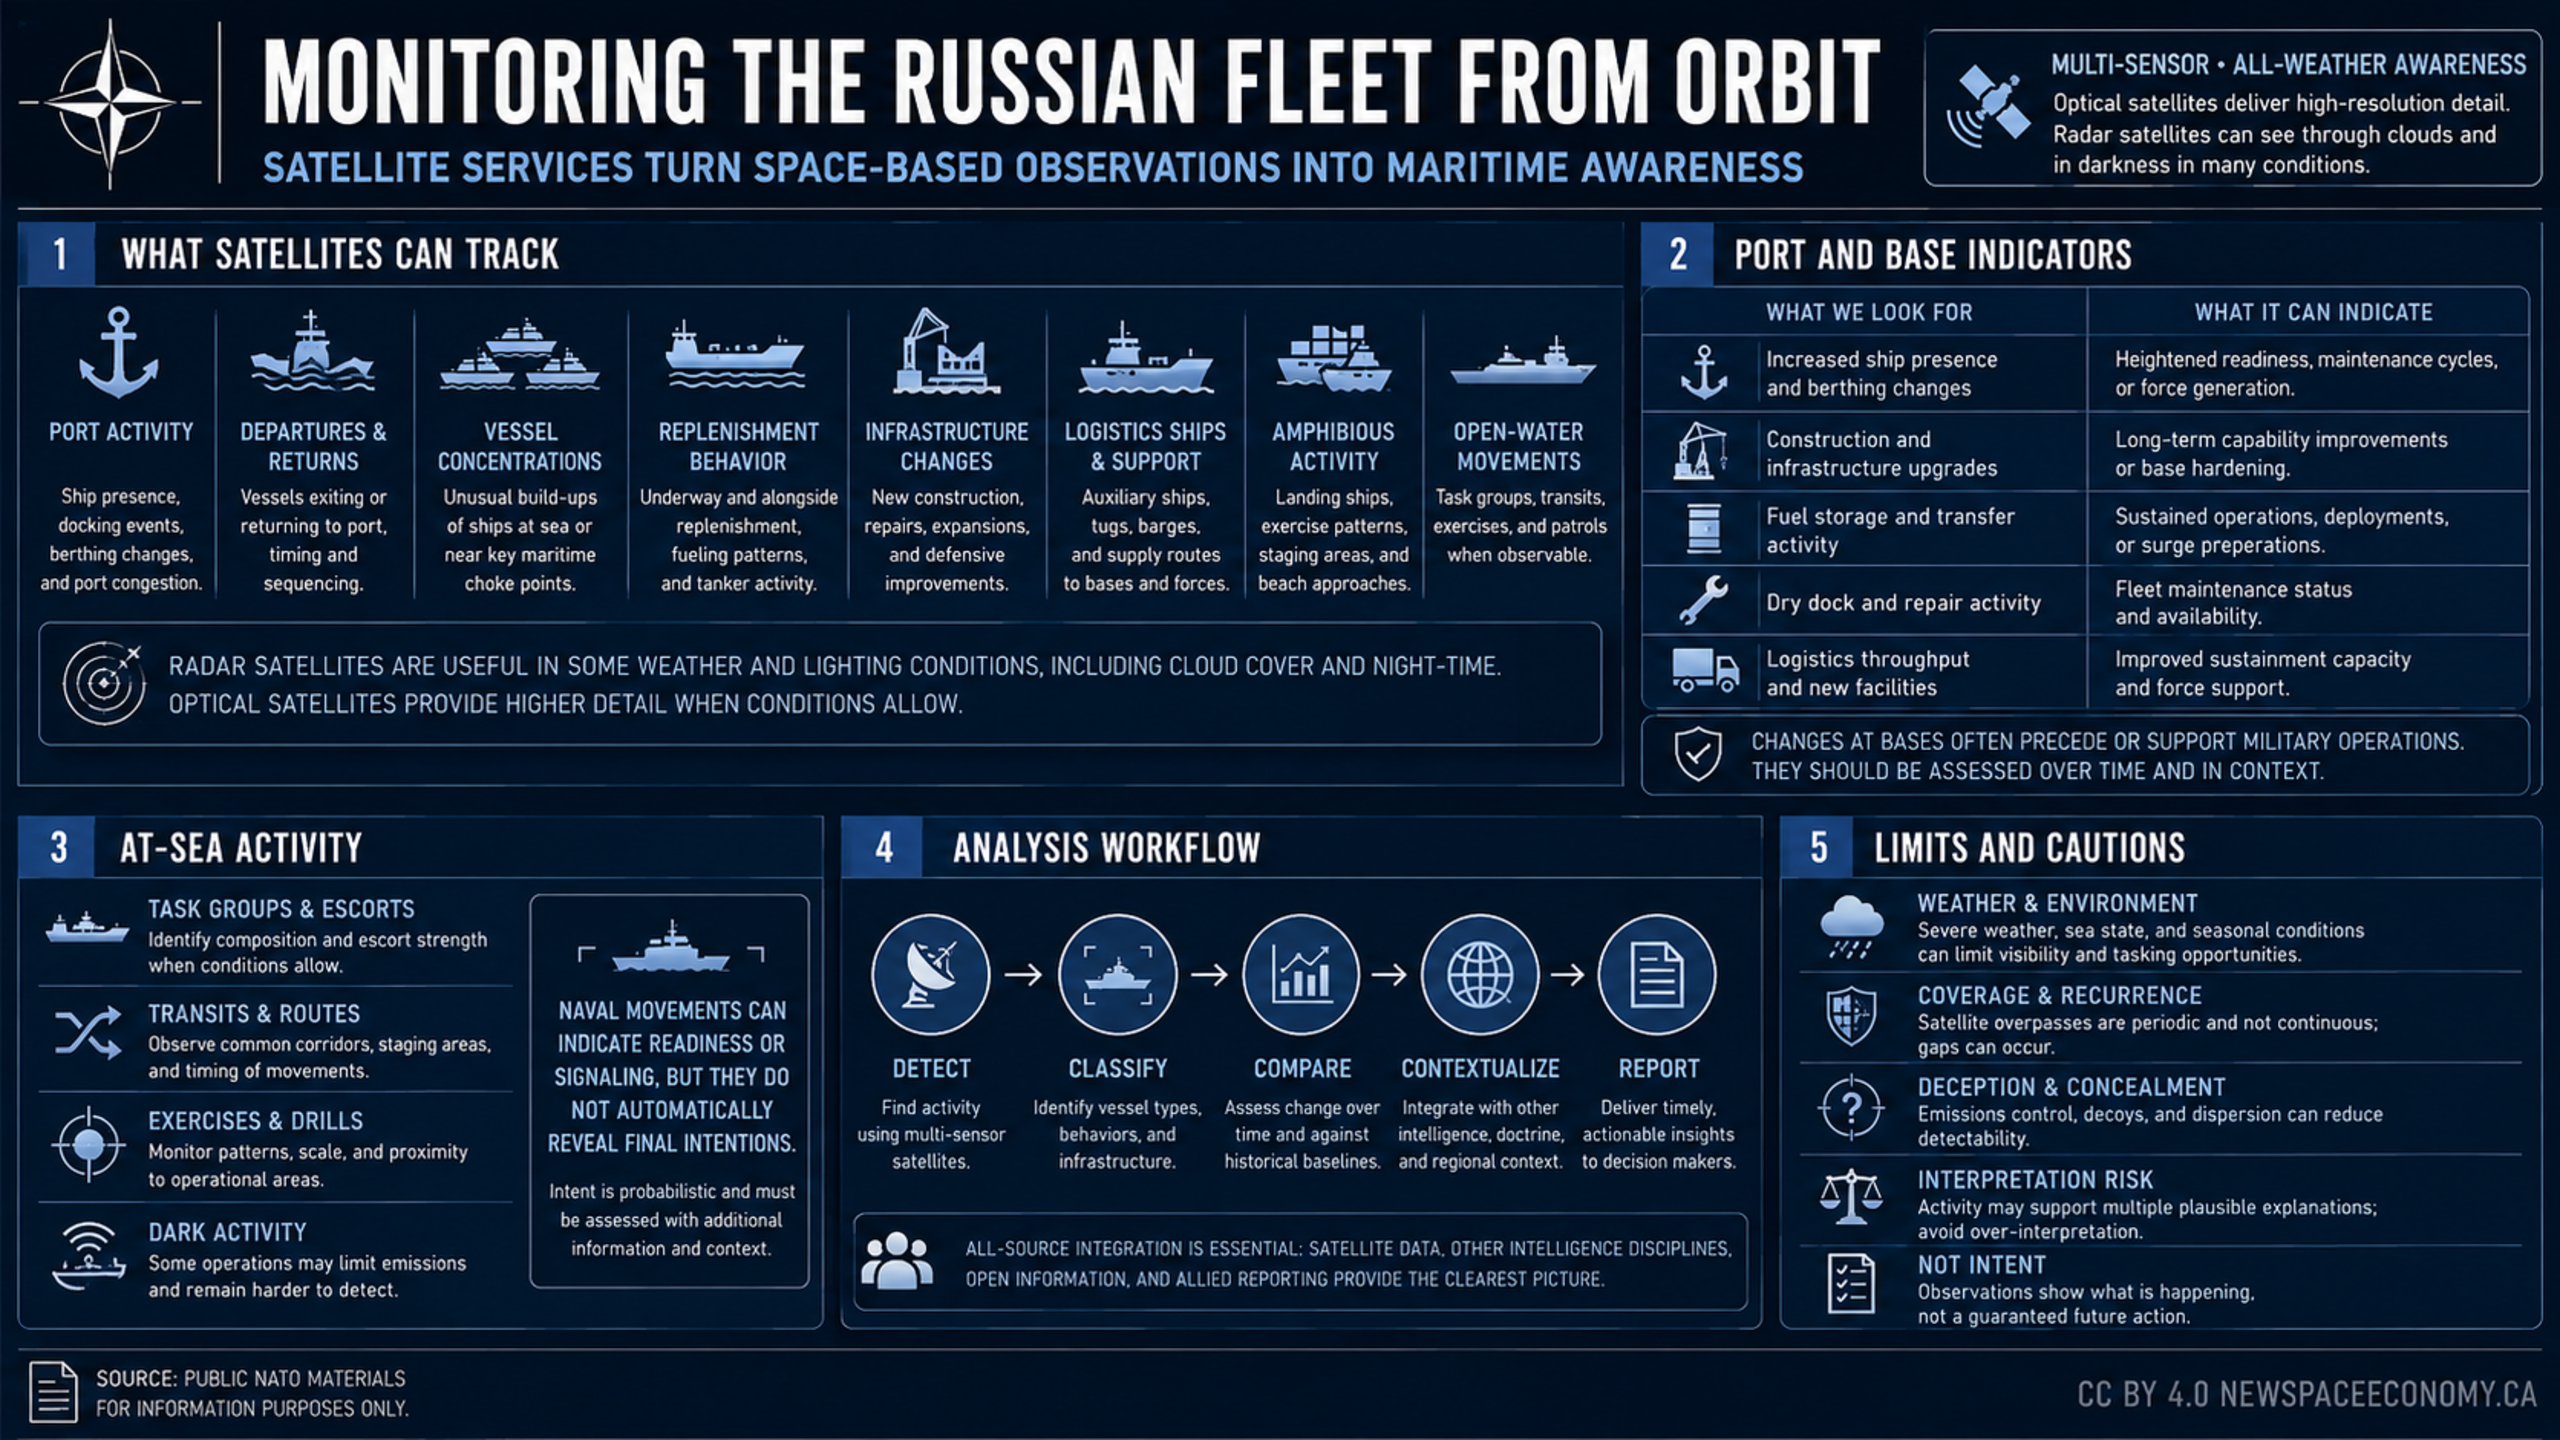
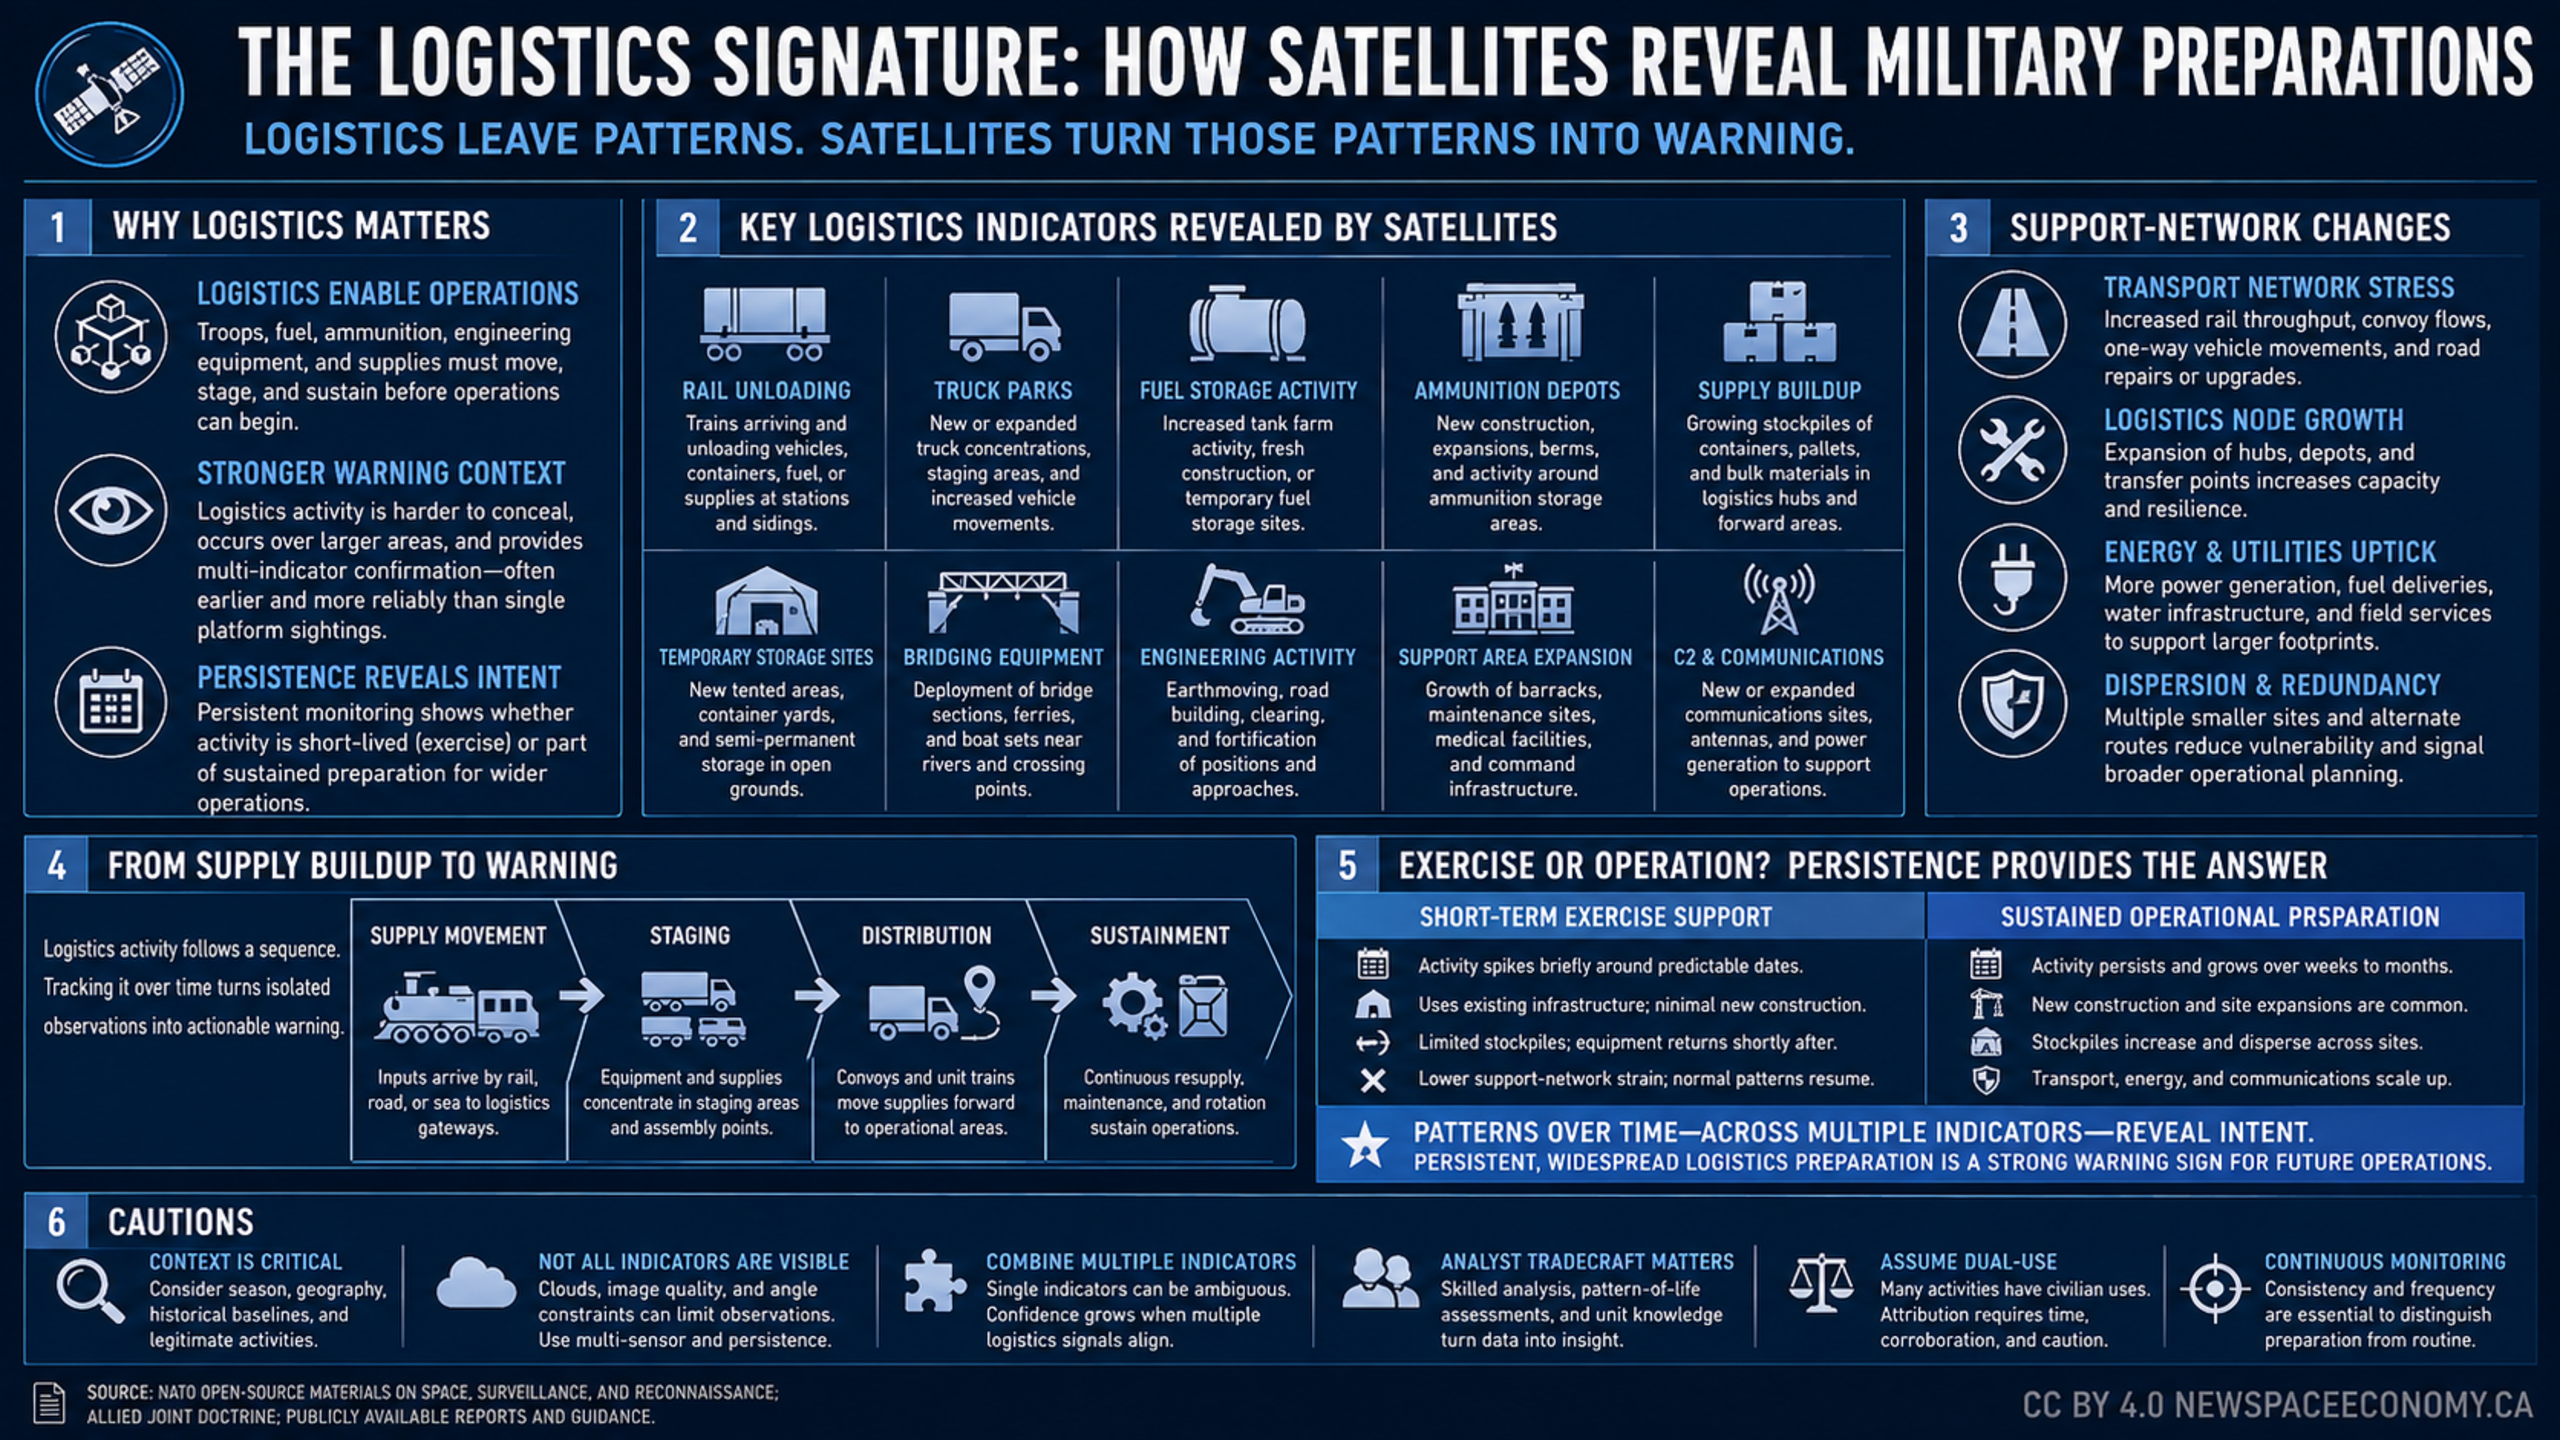
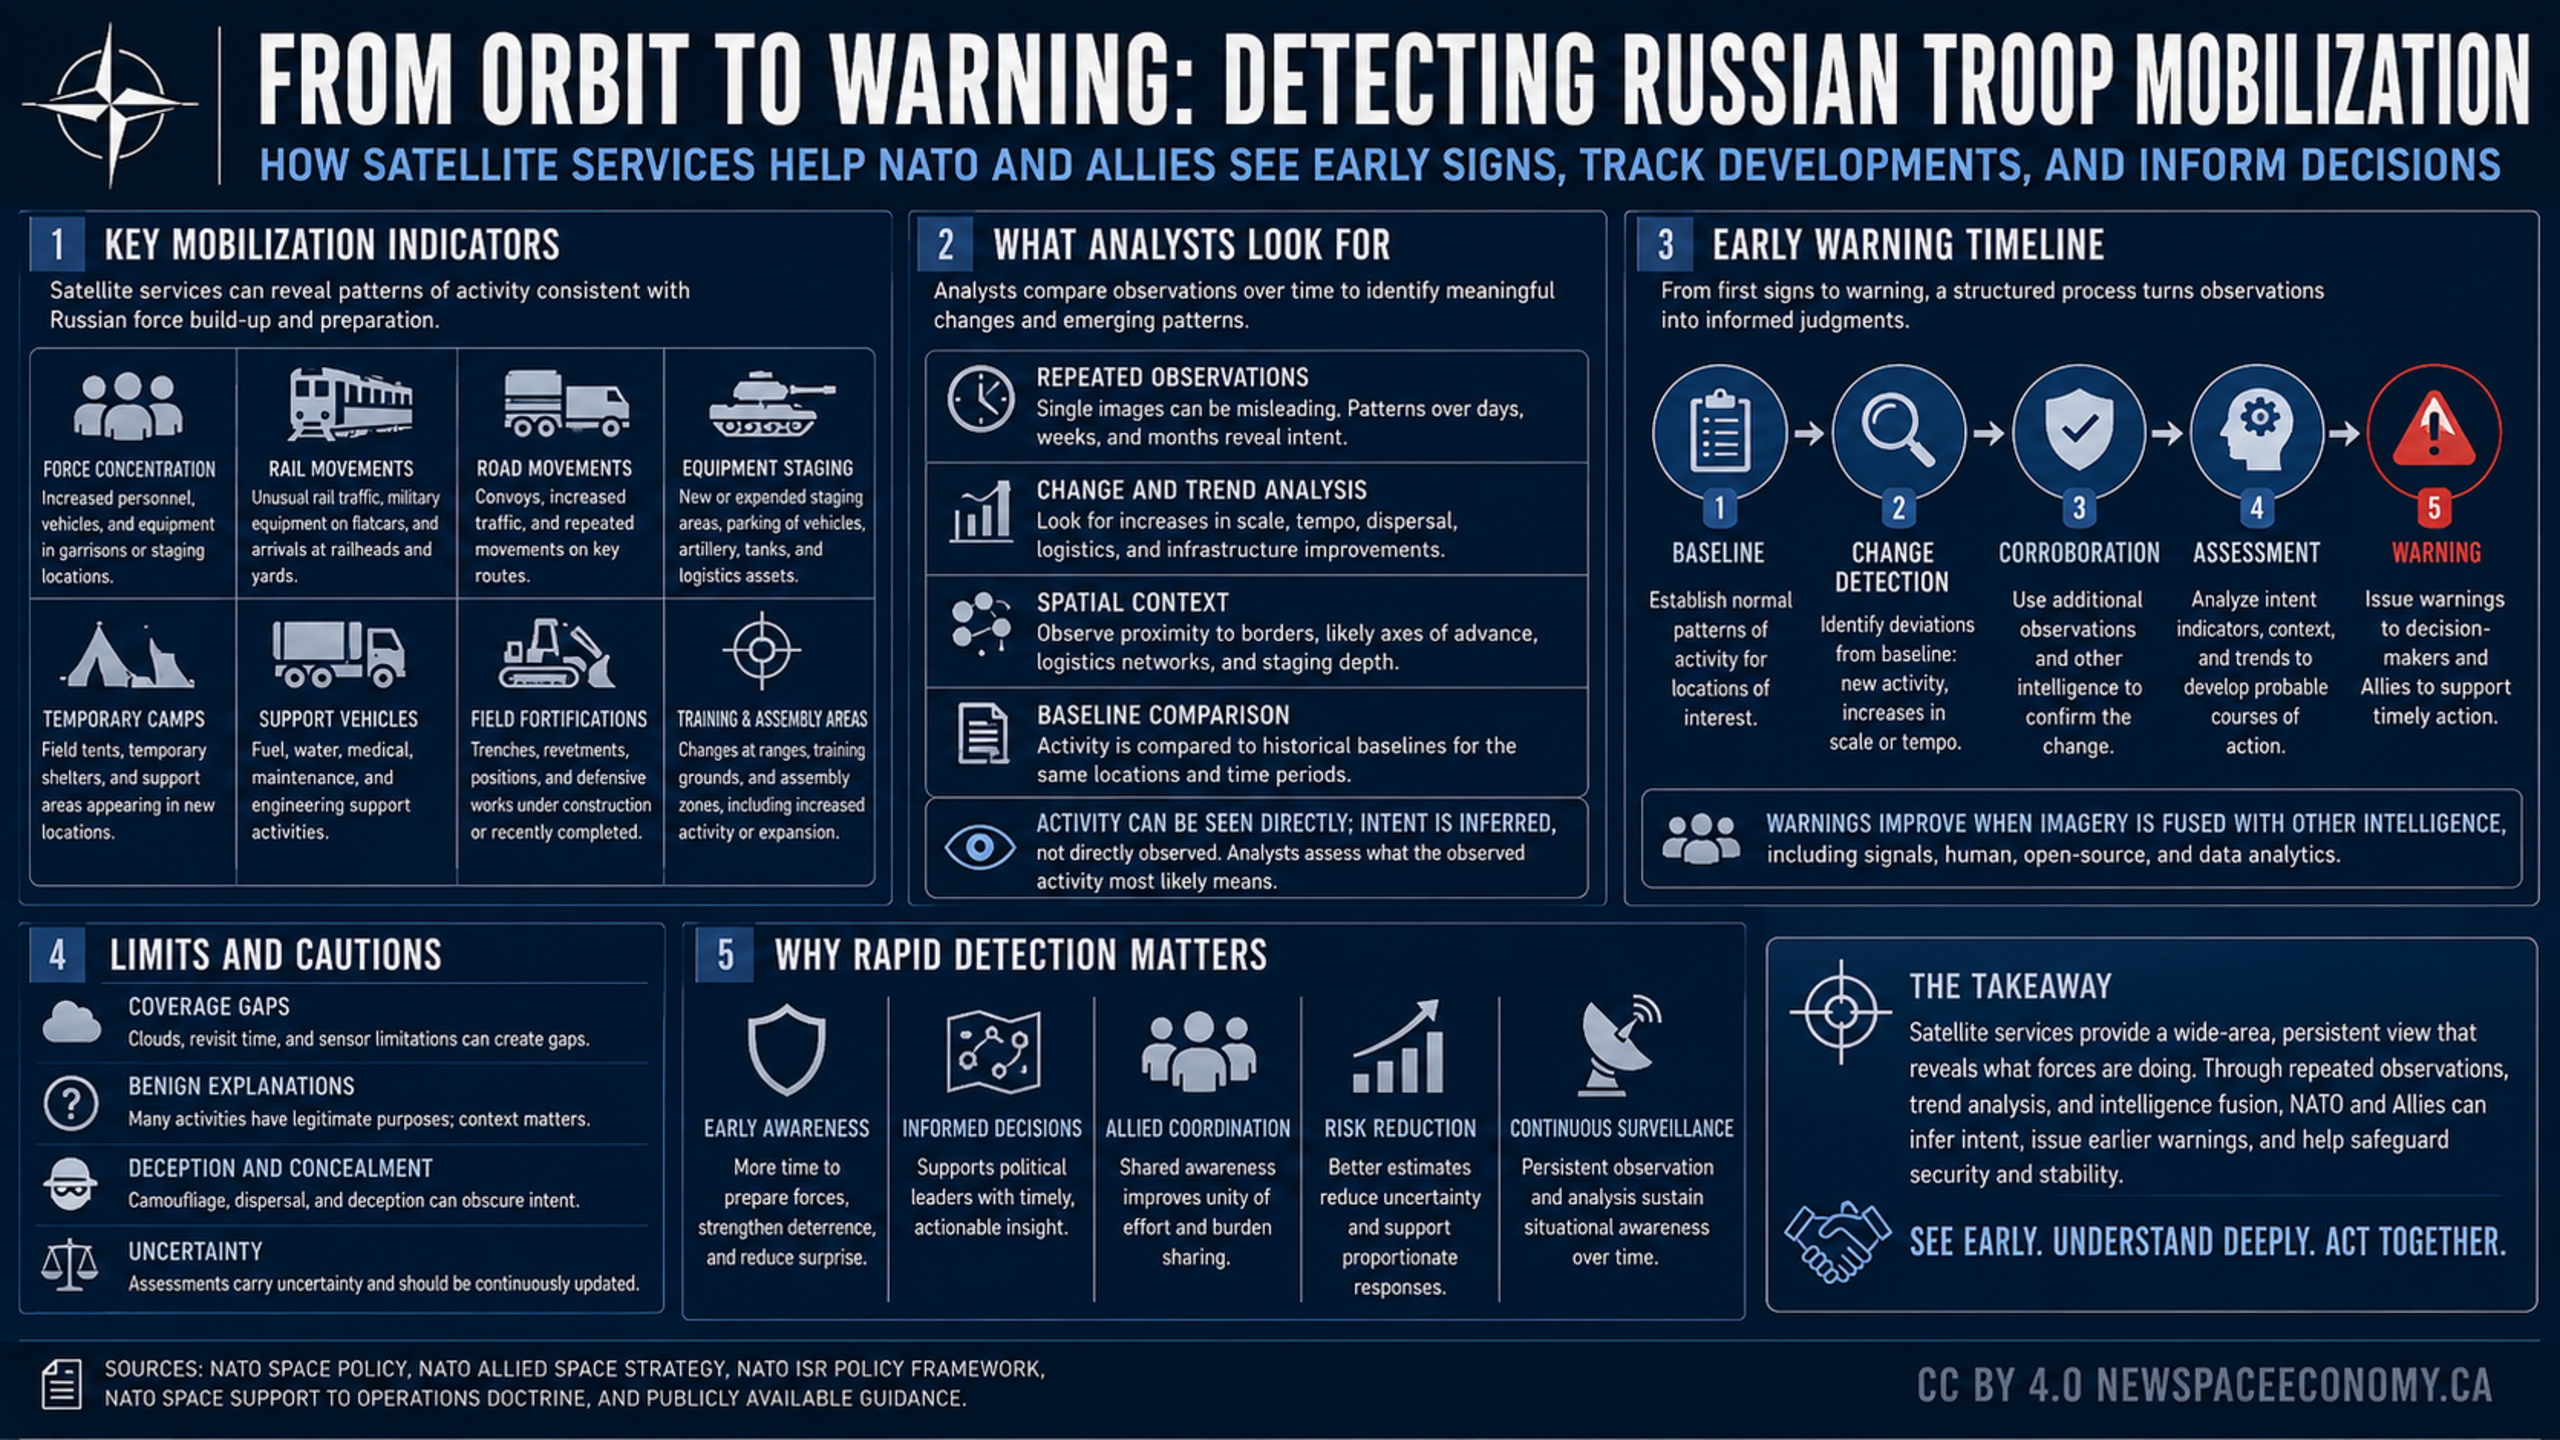
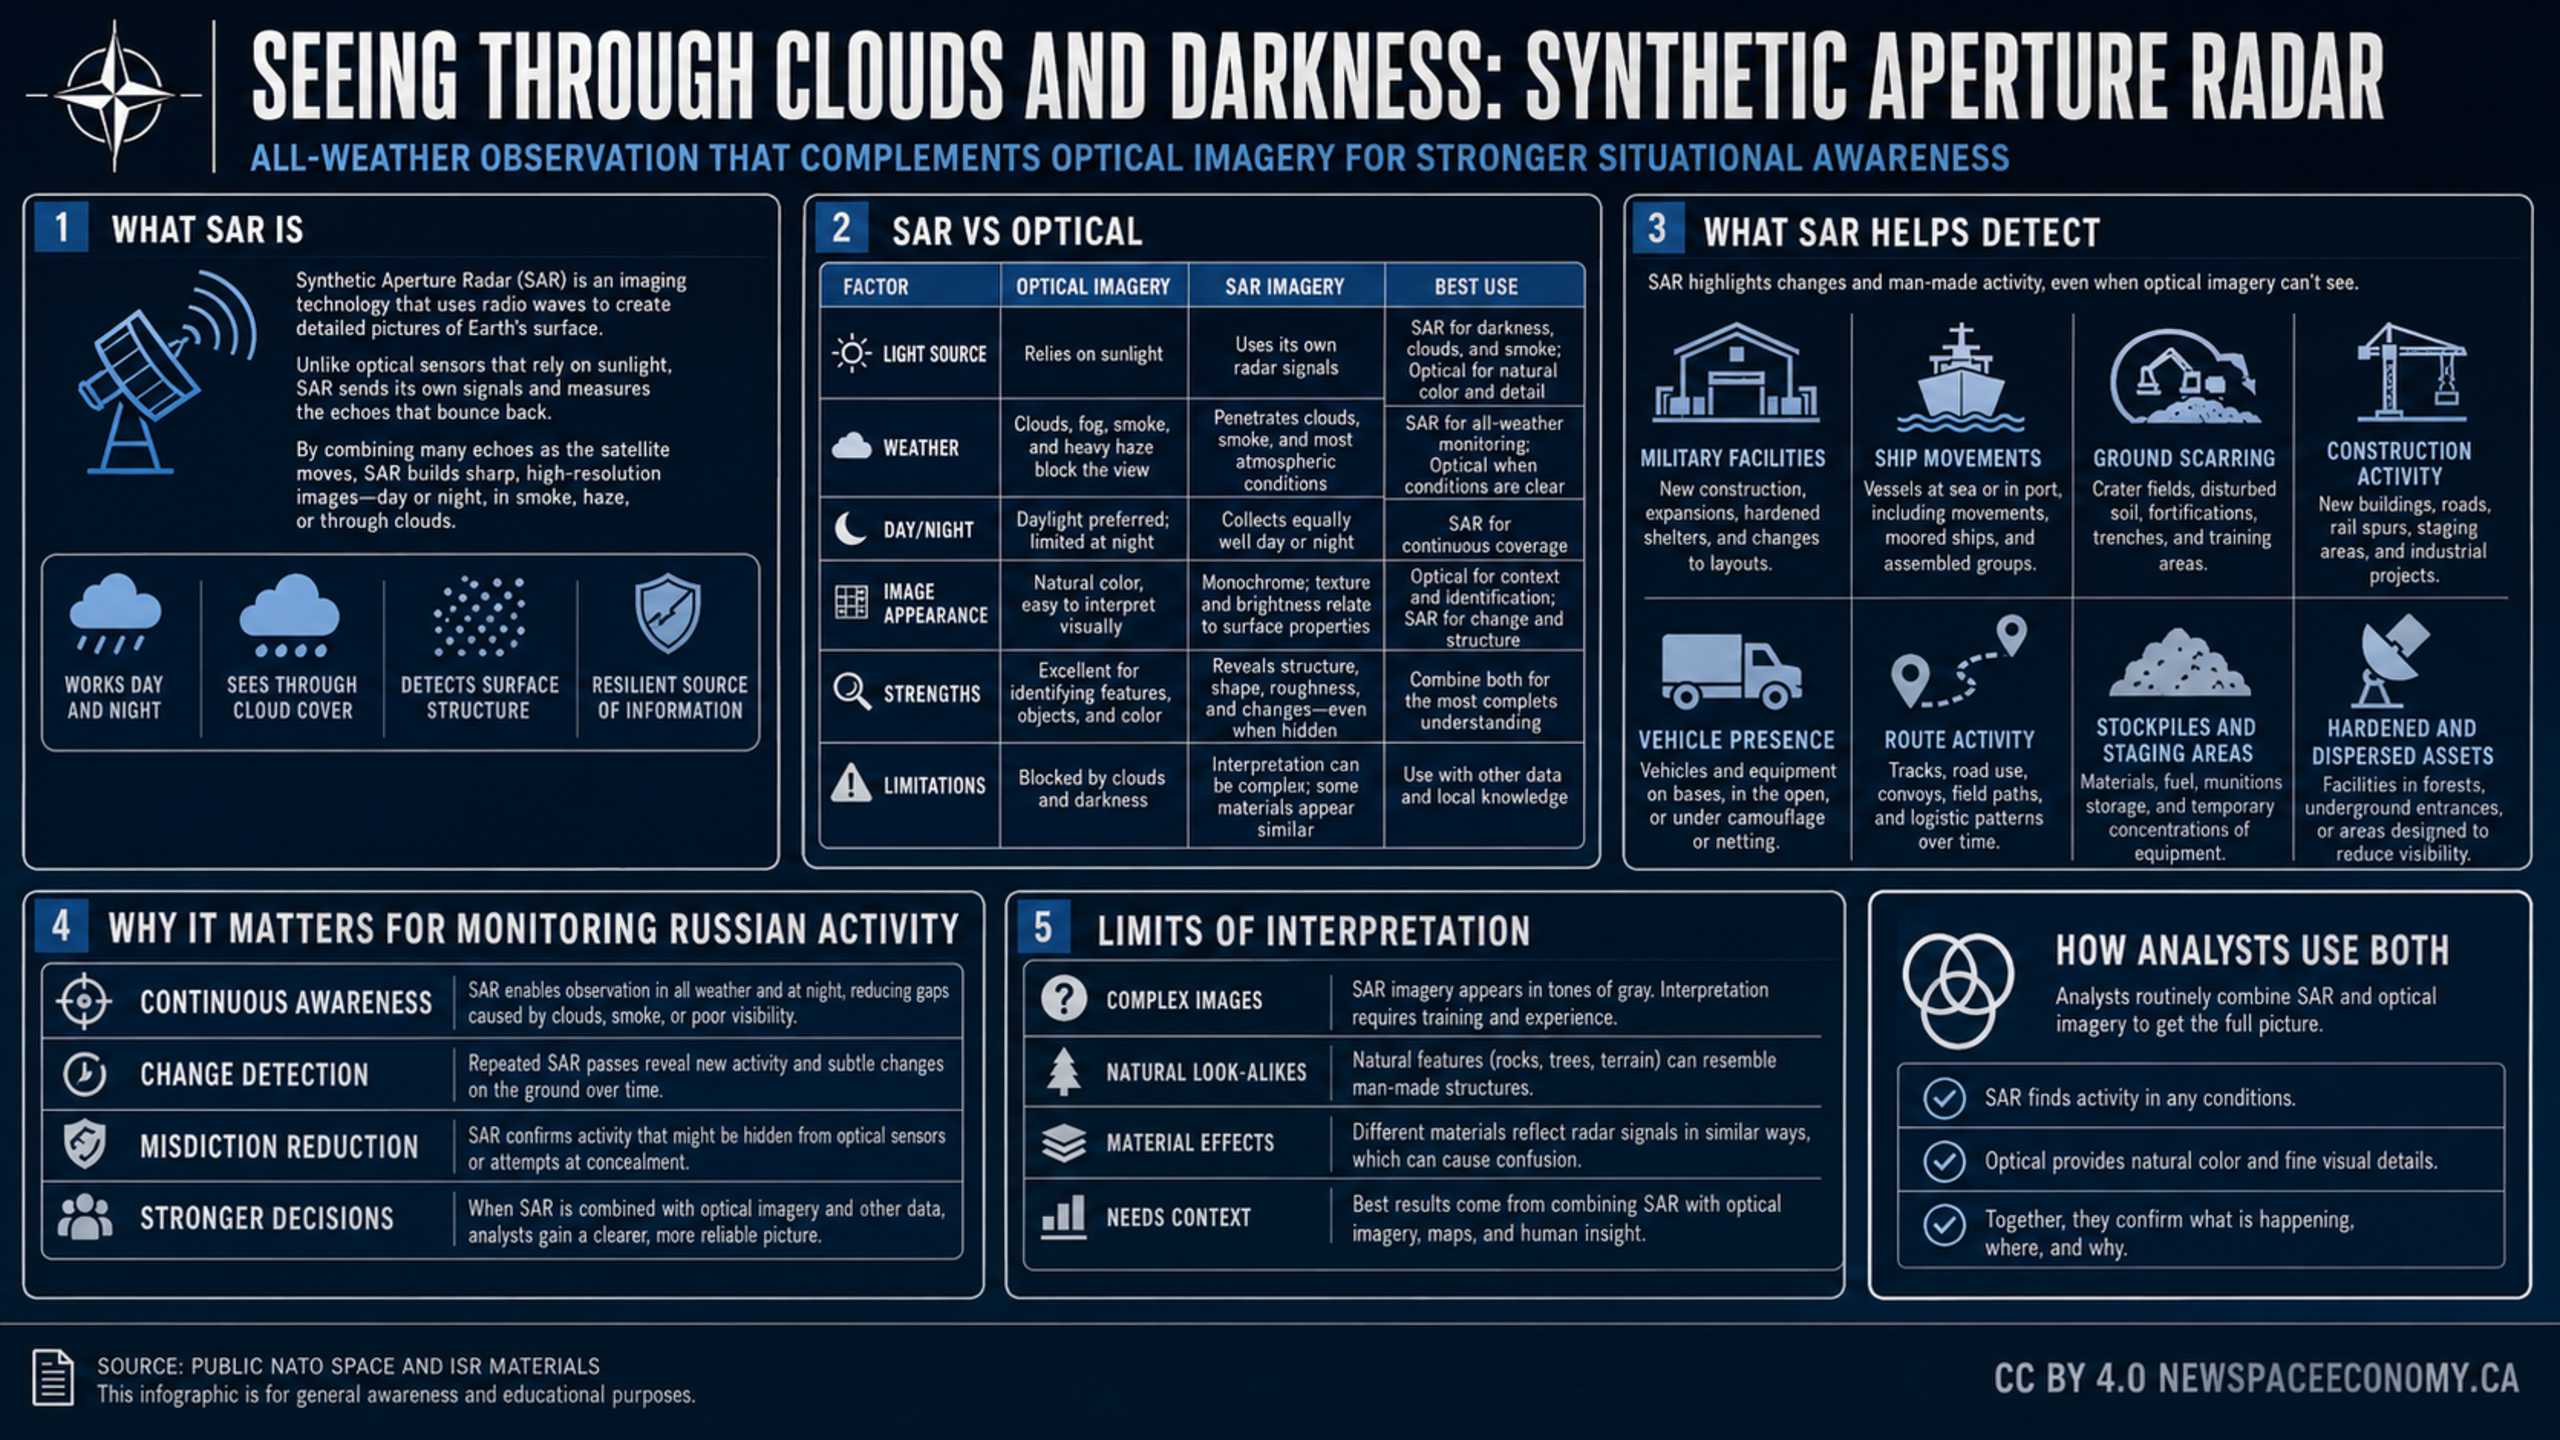
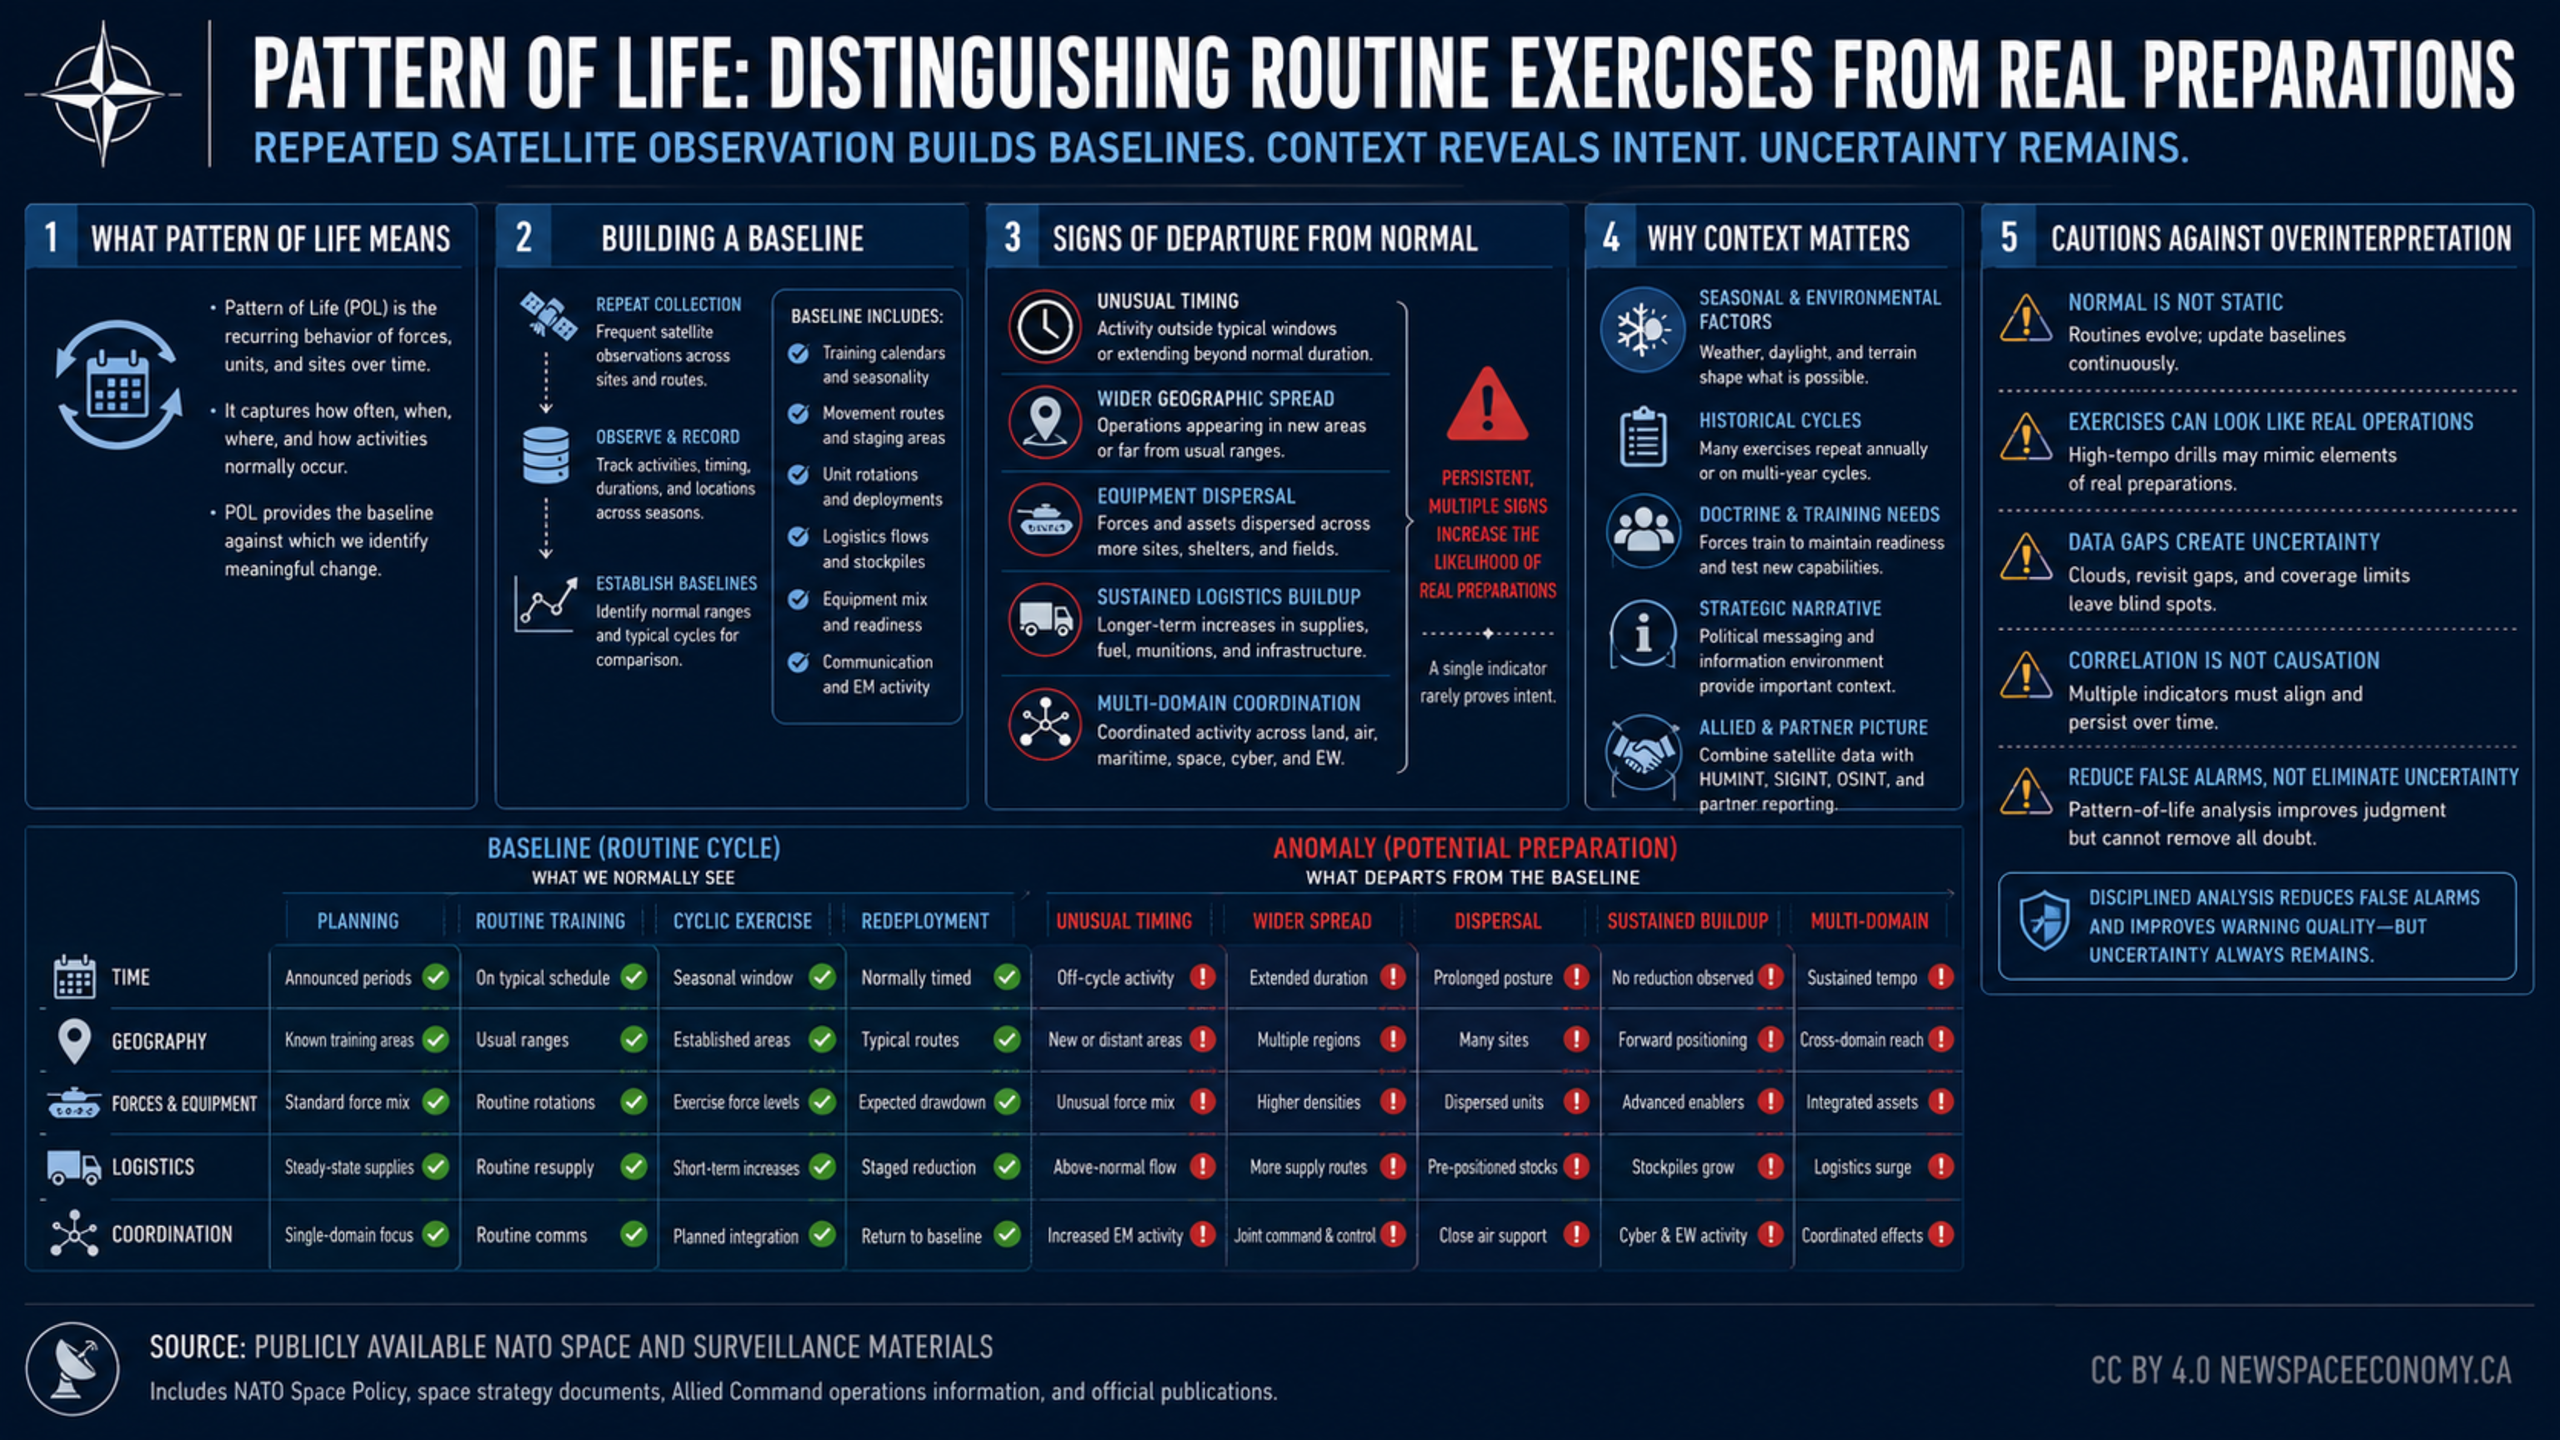
An infographic explains how repeated satellite observations establish baselines for routine activity and how analysts can assess departures from normal. It covers timing, geography, equipment, logistics, coordination, environmental context, data gaps, and the limits of interpretation.
More From This Group