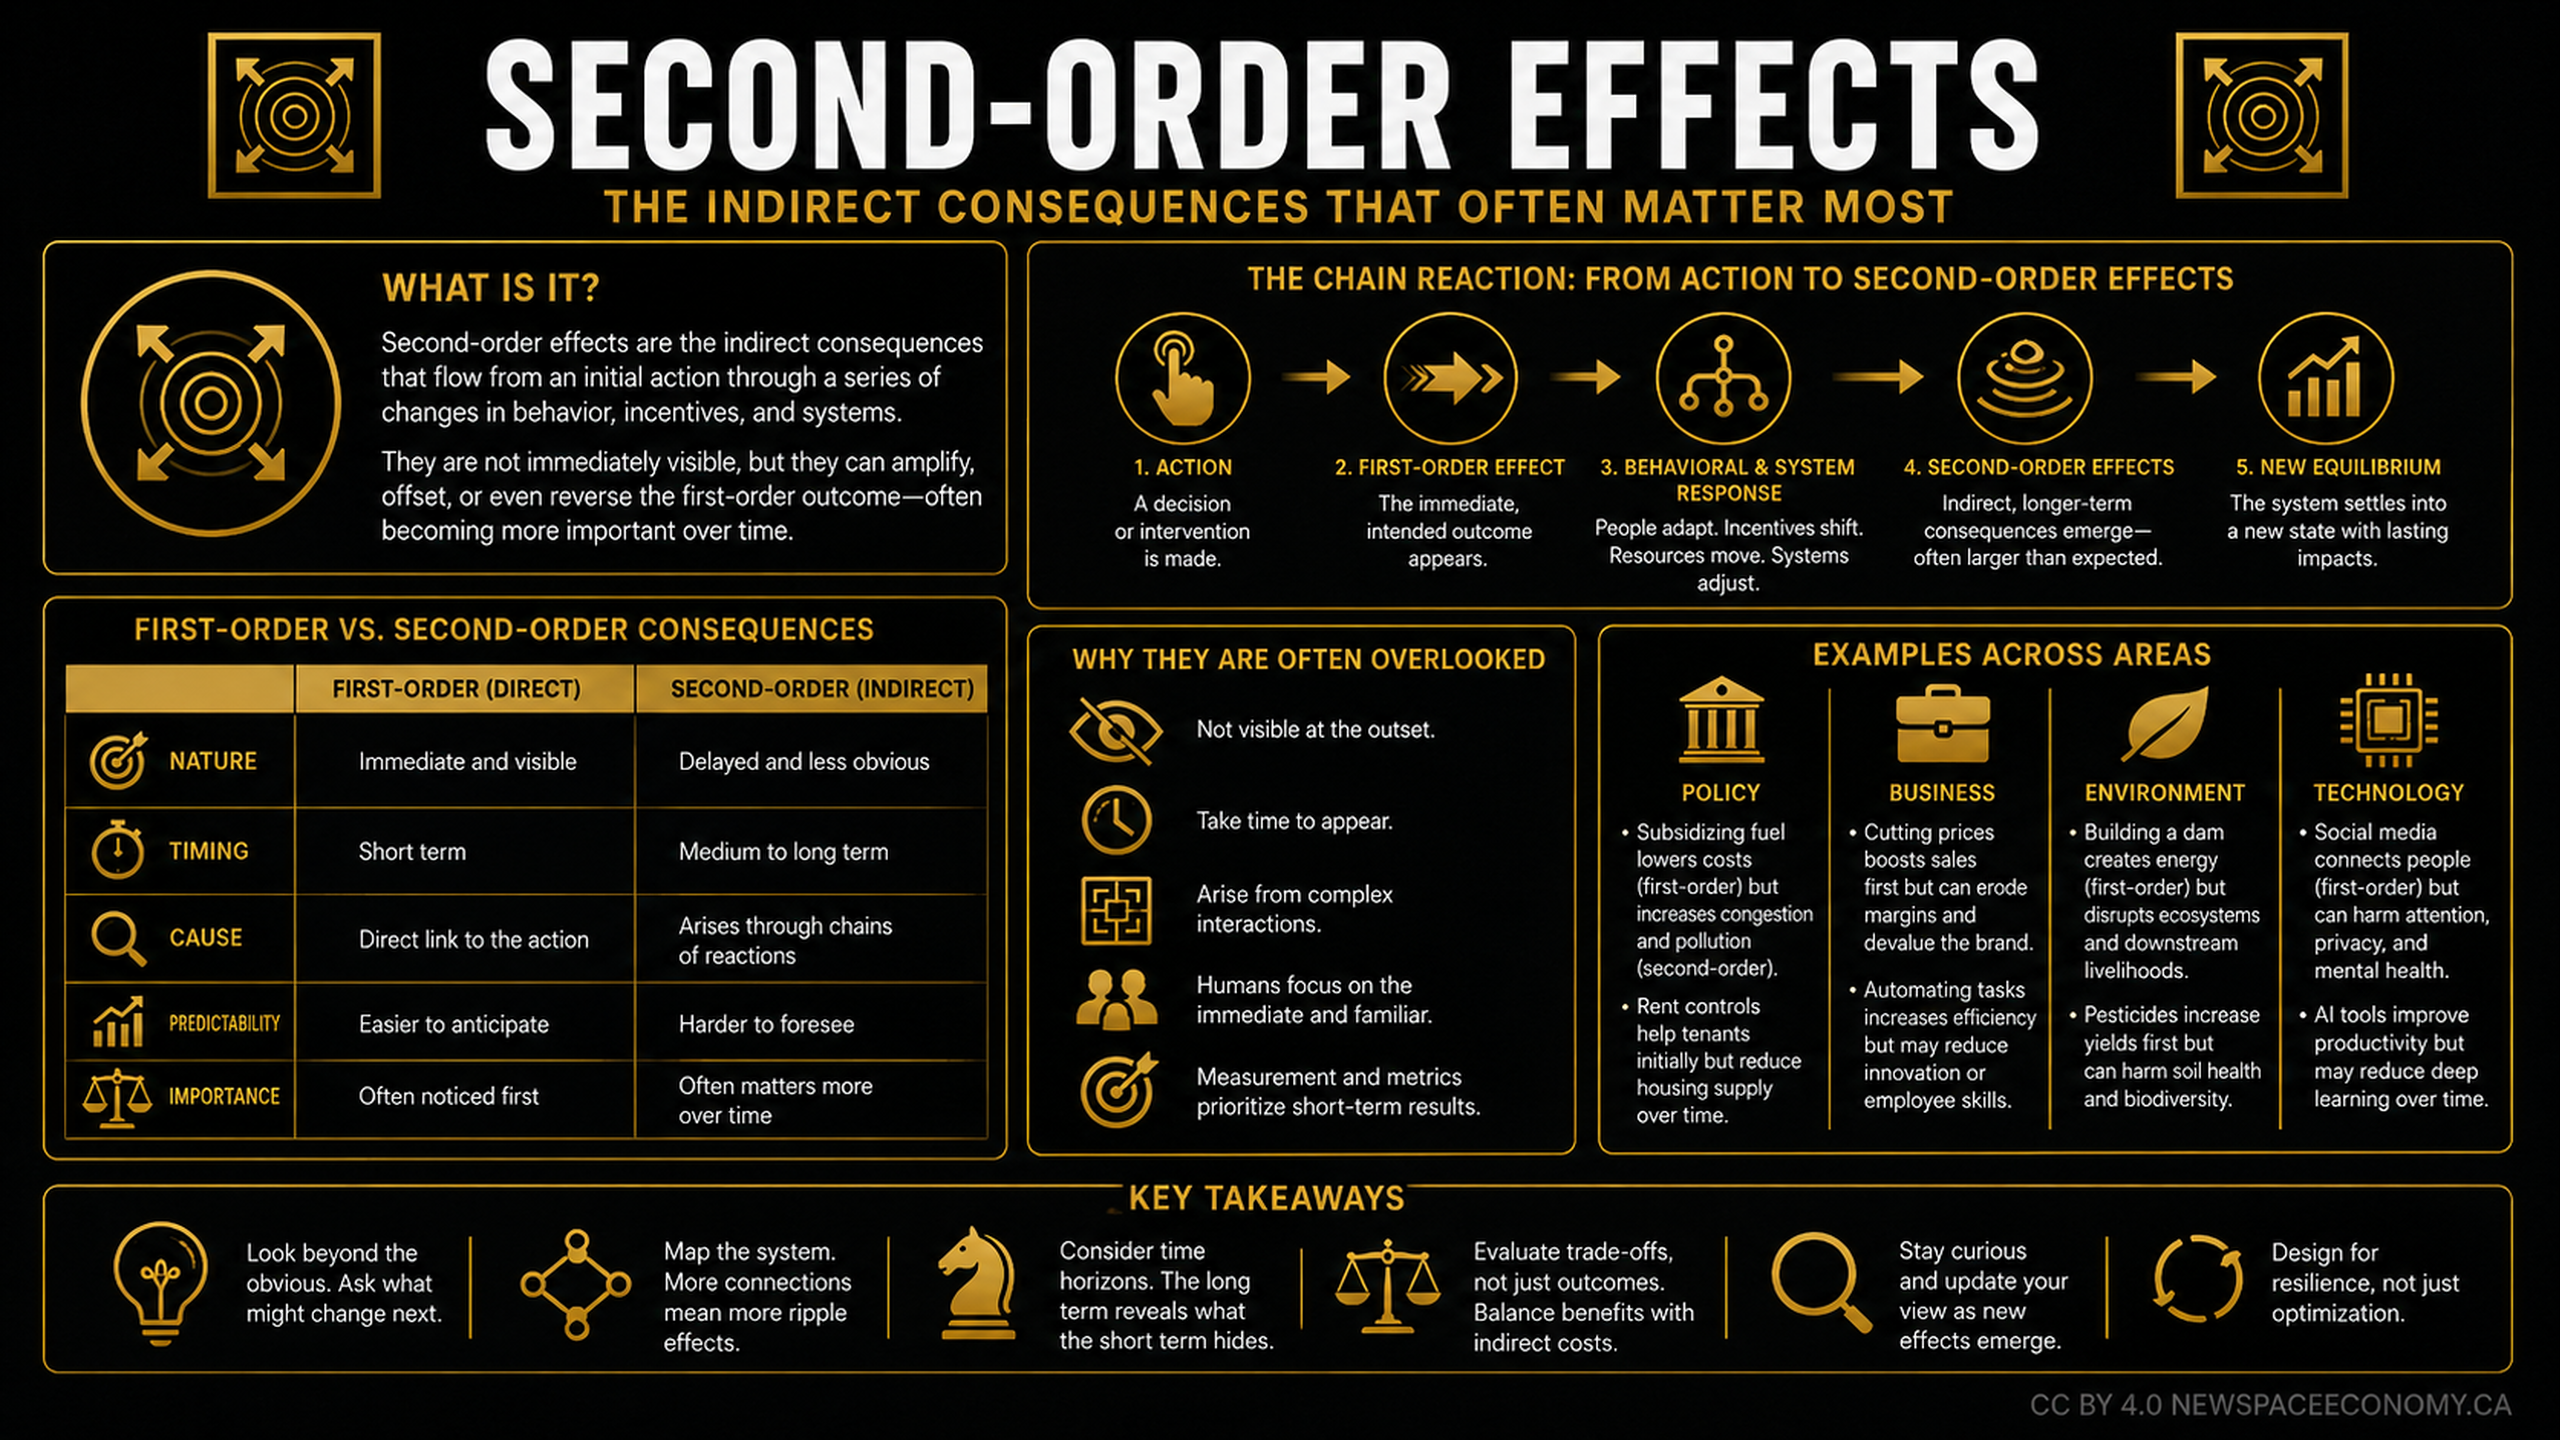
An educational infographic explains how an initial decision can produce delayed and indirect consequences through changes in behavior, incentives, and systems. It compares direct and indirect outcomes and provides examples across policy, business, environmental action, and technology.
More From This Group