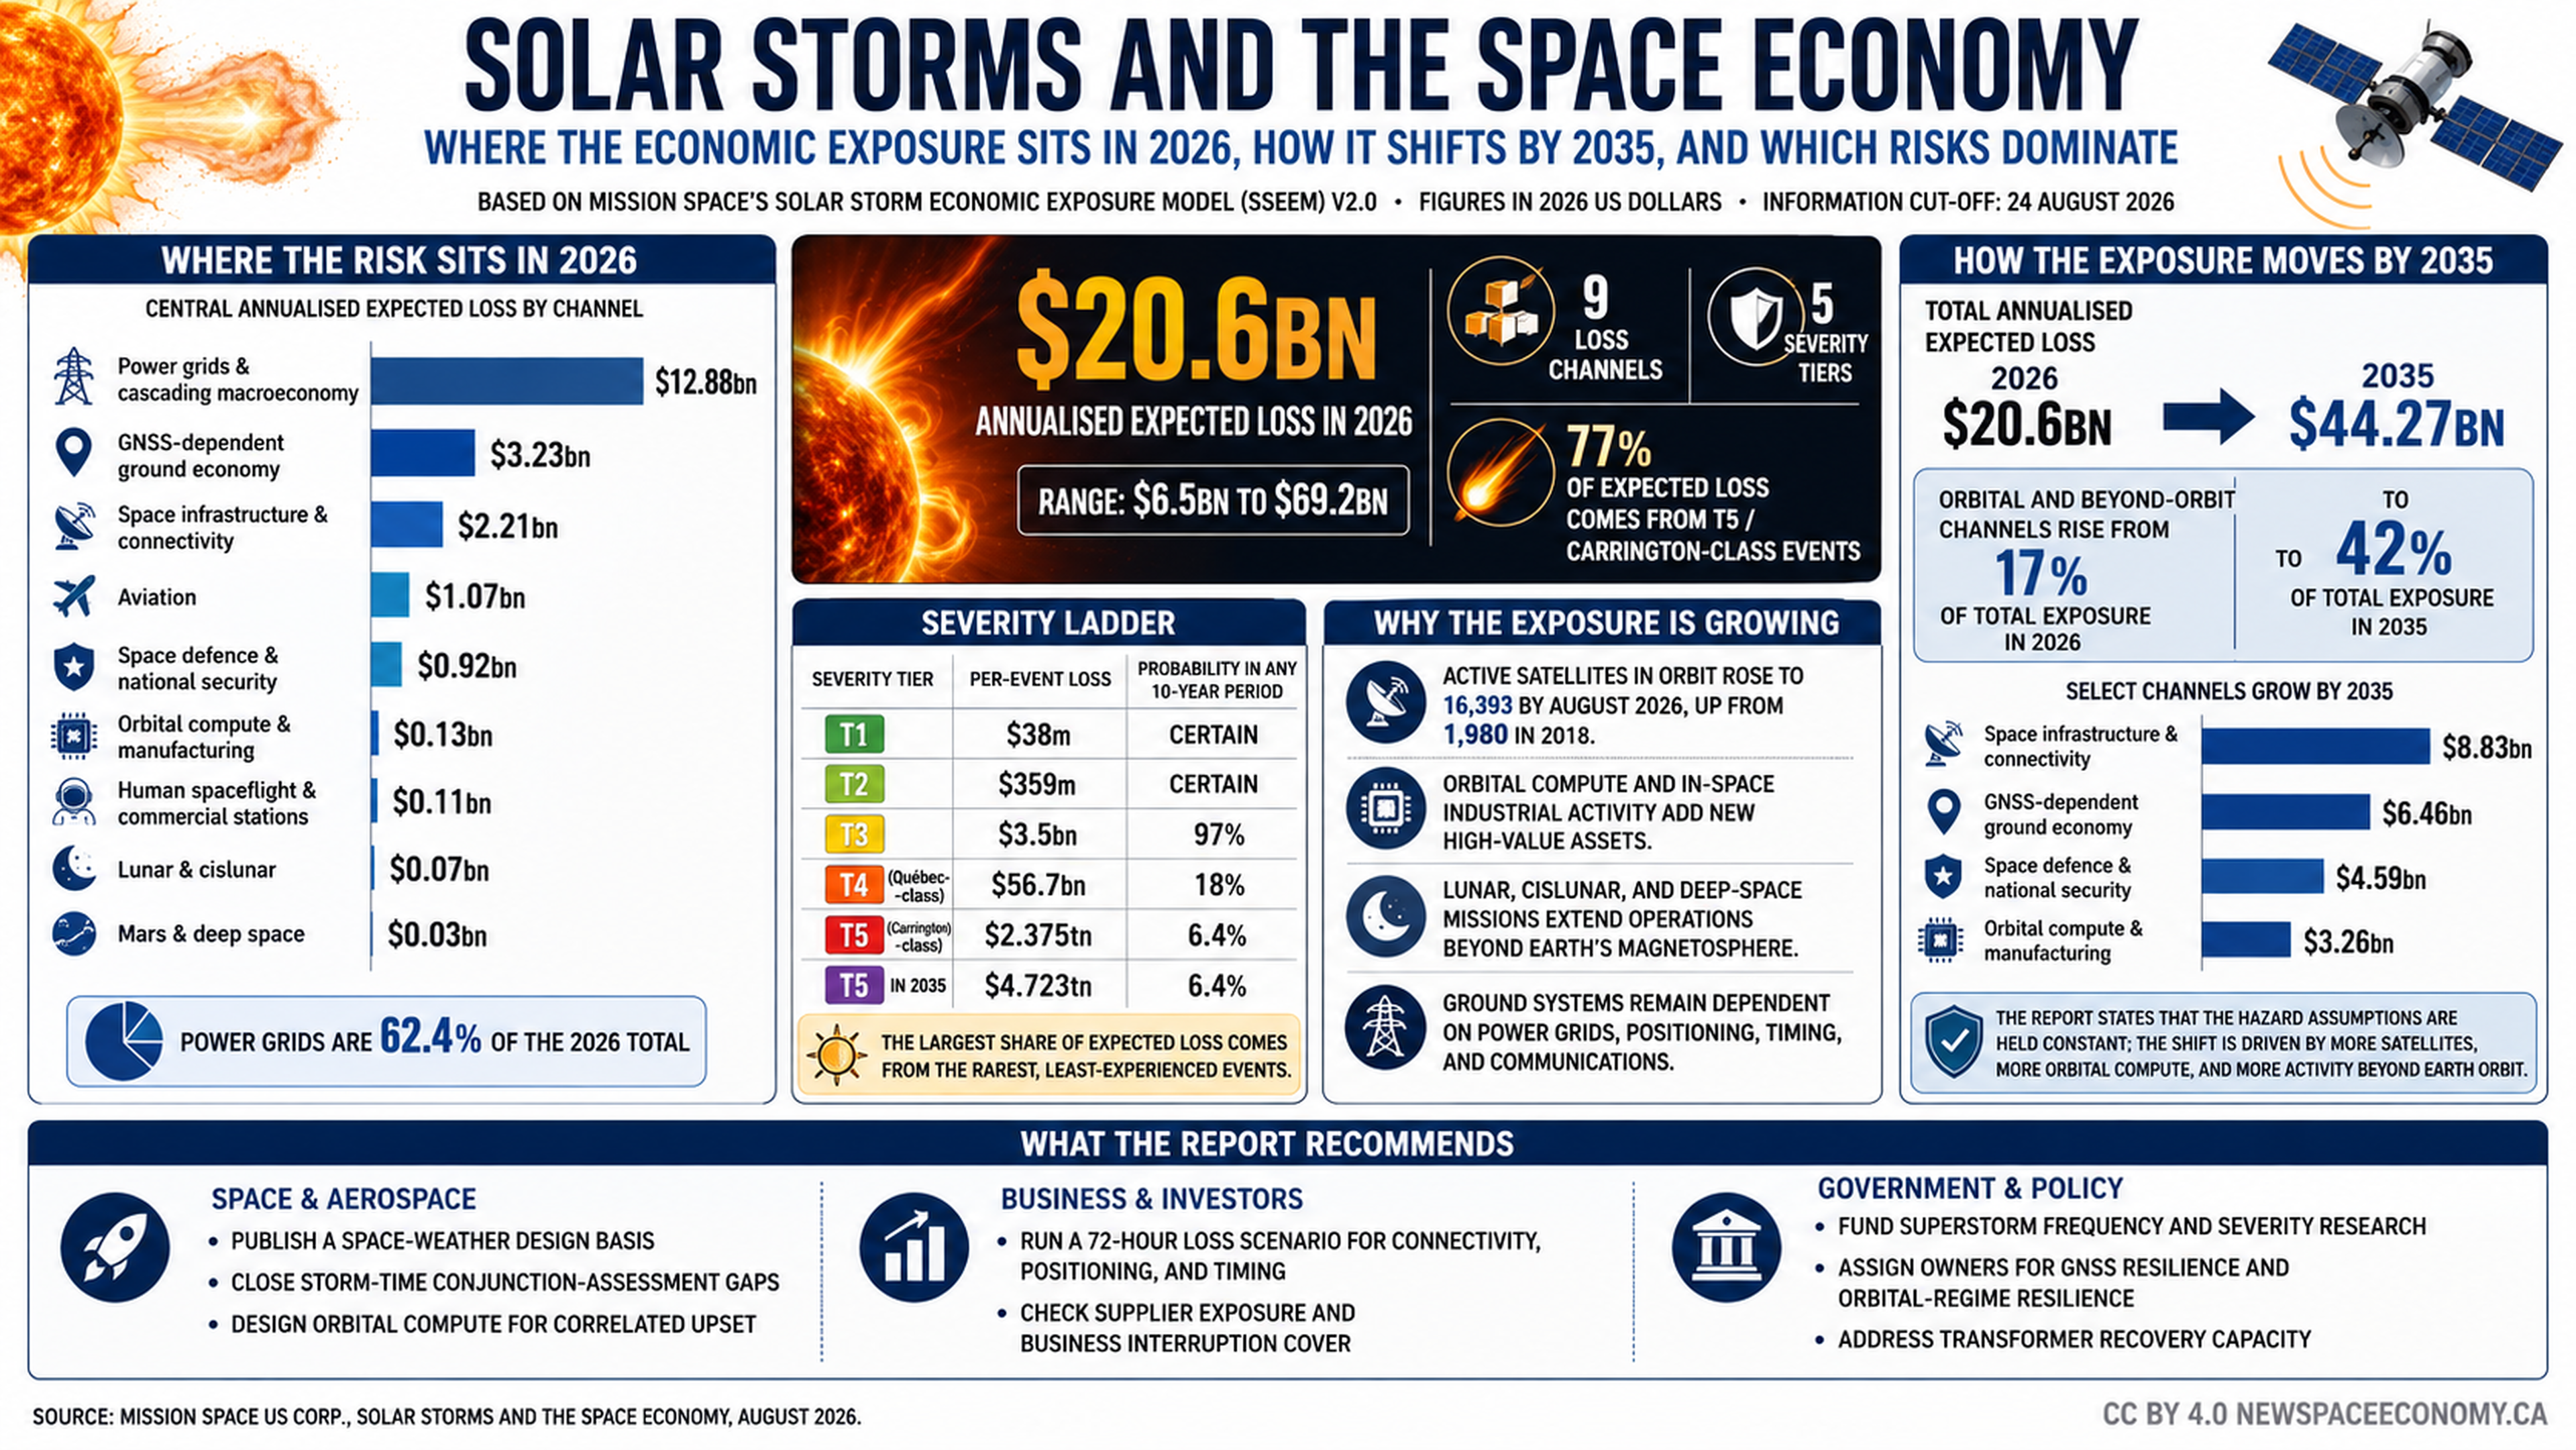
A data-rich infographic examines modeled economic losses associated with solar-storm events across terrestrial and space-dependent systems. It compares 2026 exposure with projections for 2035 and presents risk channels, severity tiers, growth factors, and recommendations for industry, investors, government, and policy leaders.
More From This Group