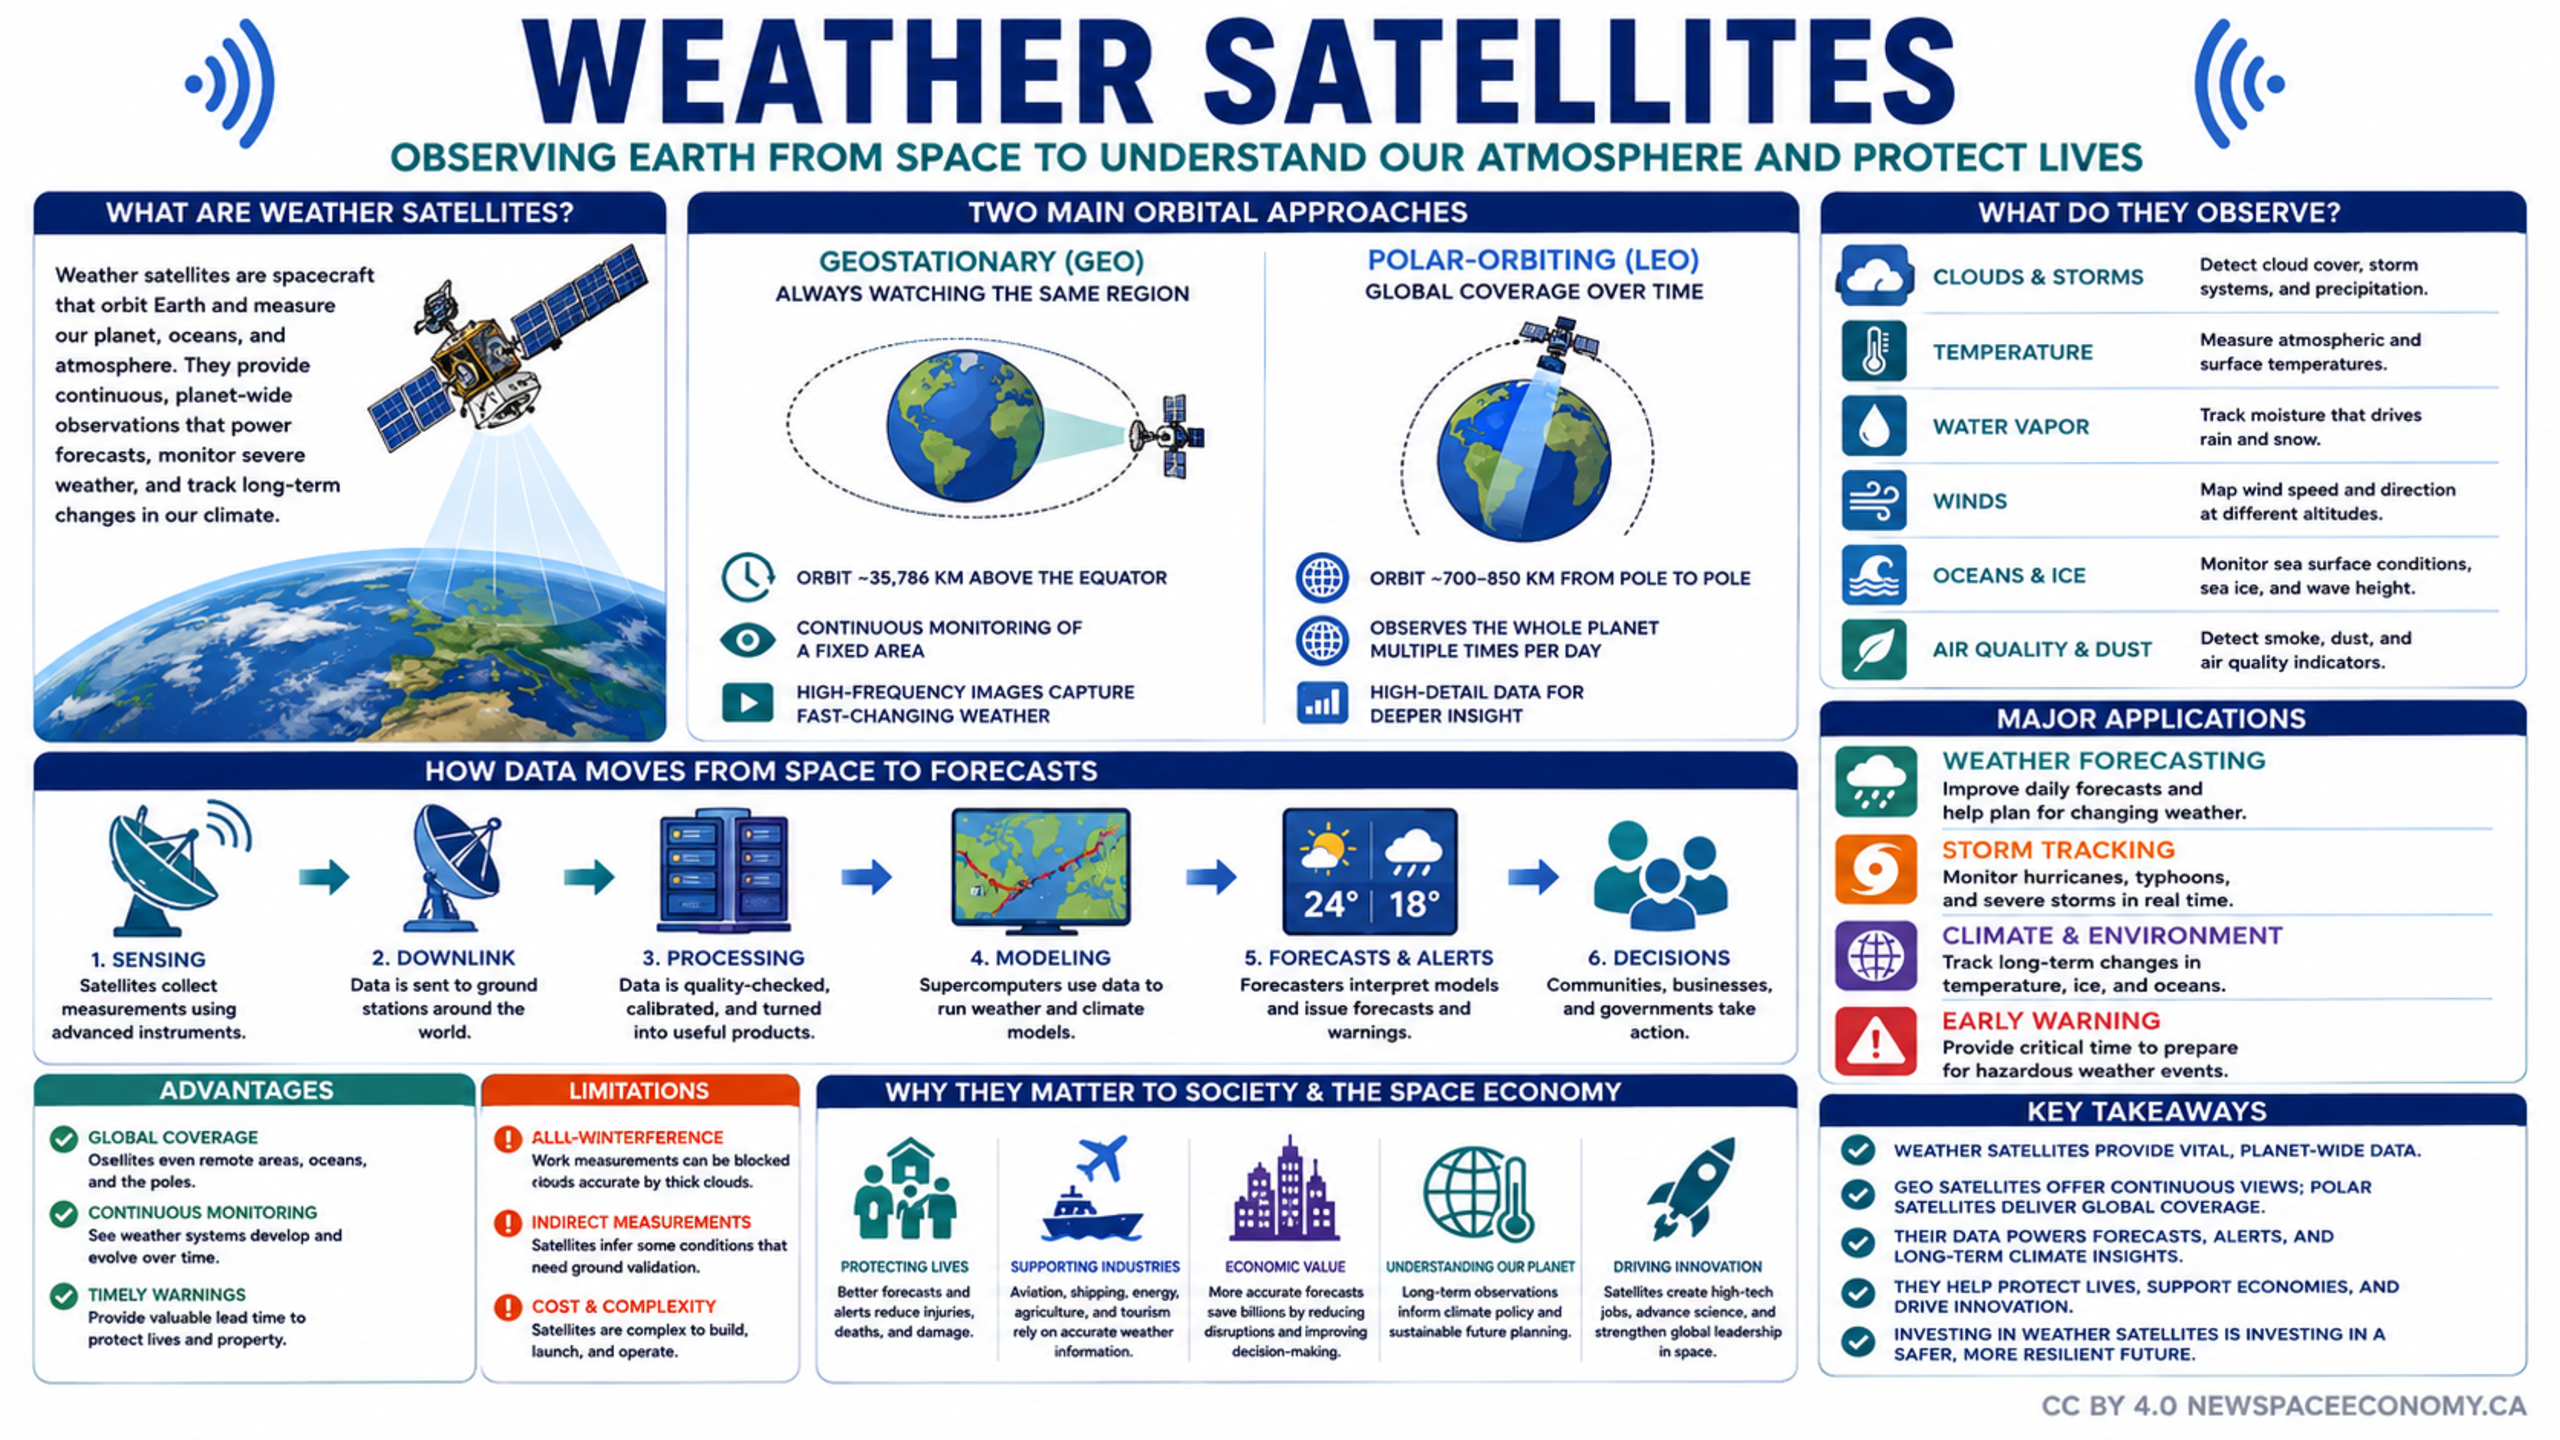
An educational infographic explains how orbiting Earth-observation spacecraft monitor atmospheric and surface conditions. It compares geostationary and polar orbits, traces data from sensing through forecasting and decision-making, and summarizes their applications, benefits, and limitations.
More From This Group