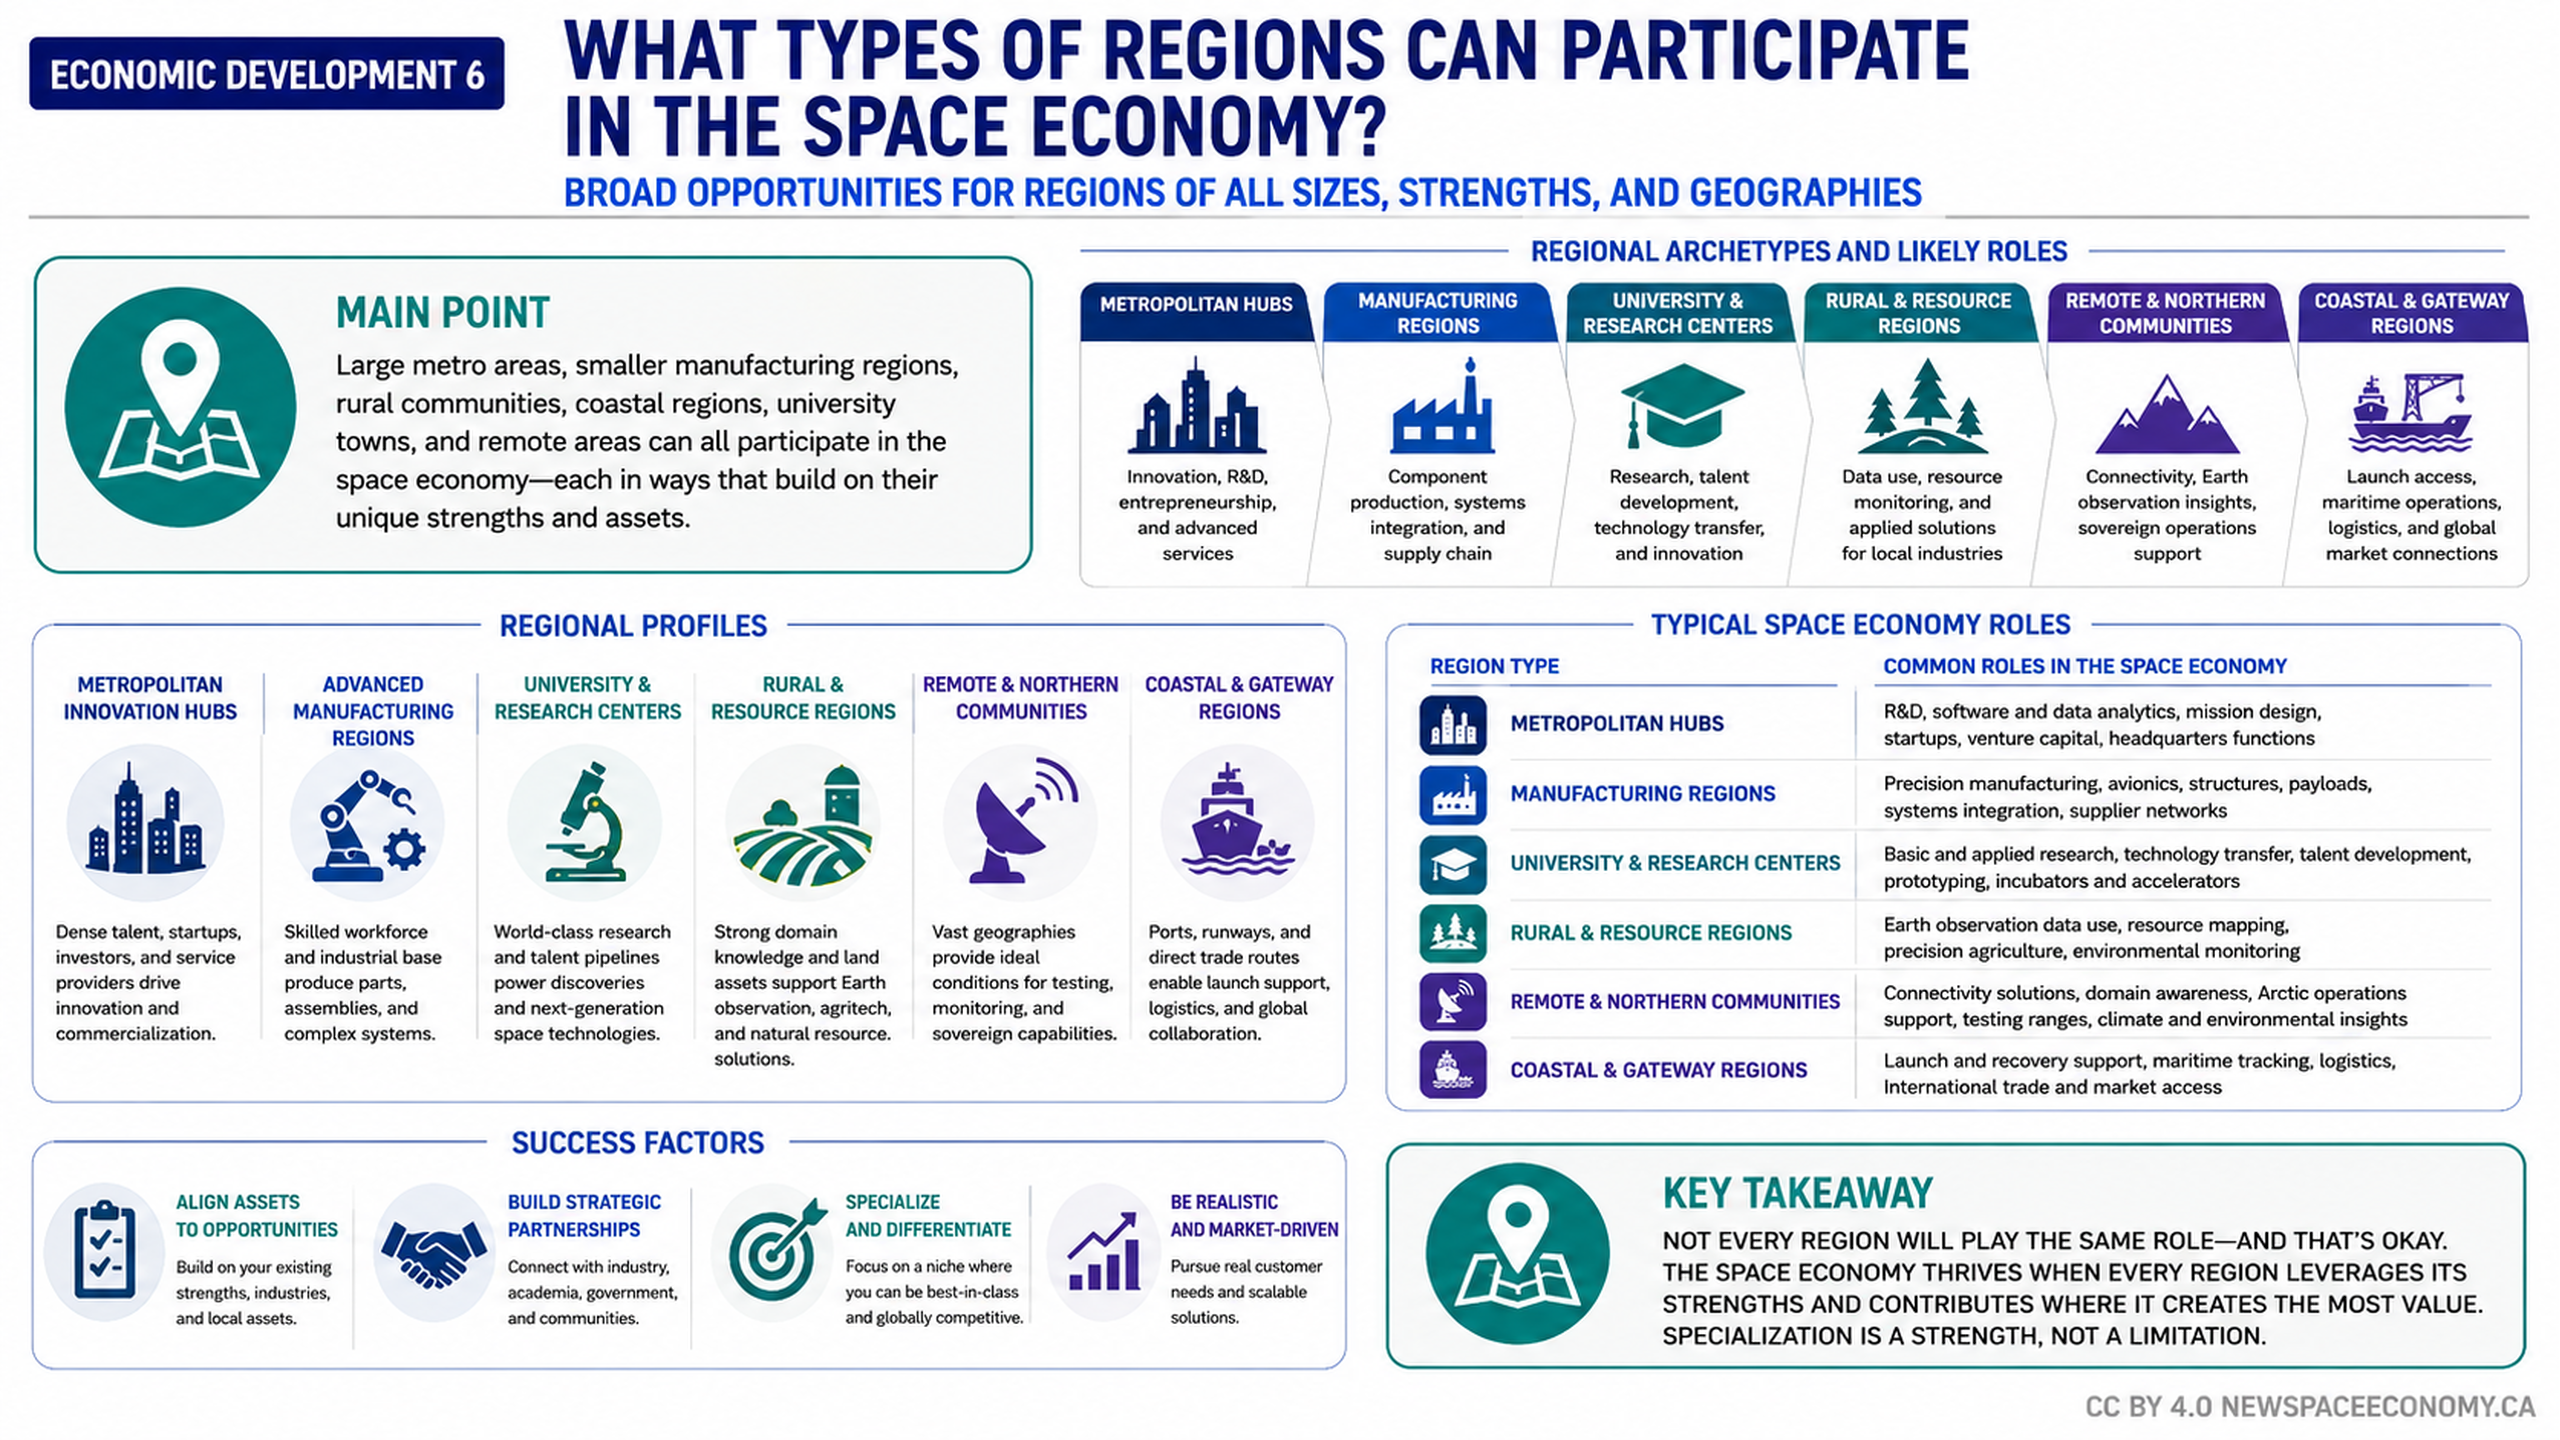
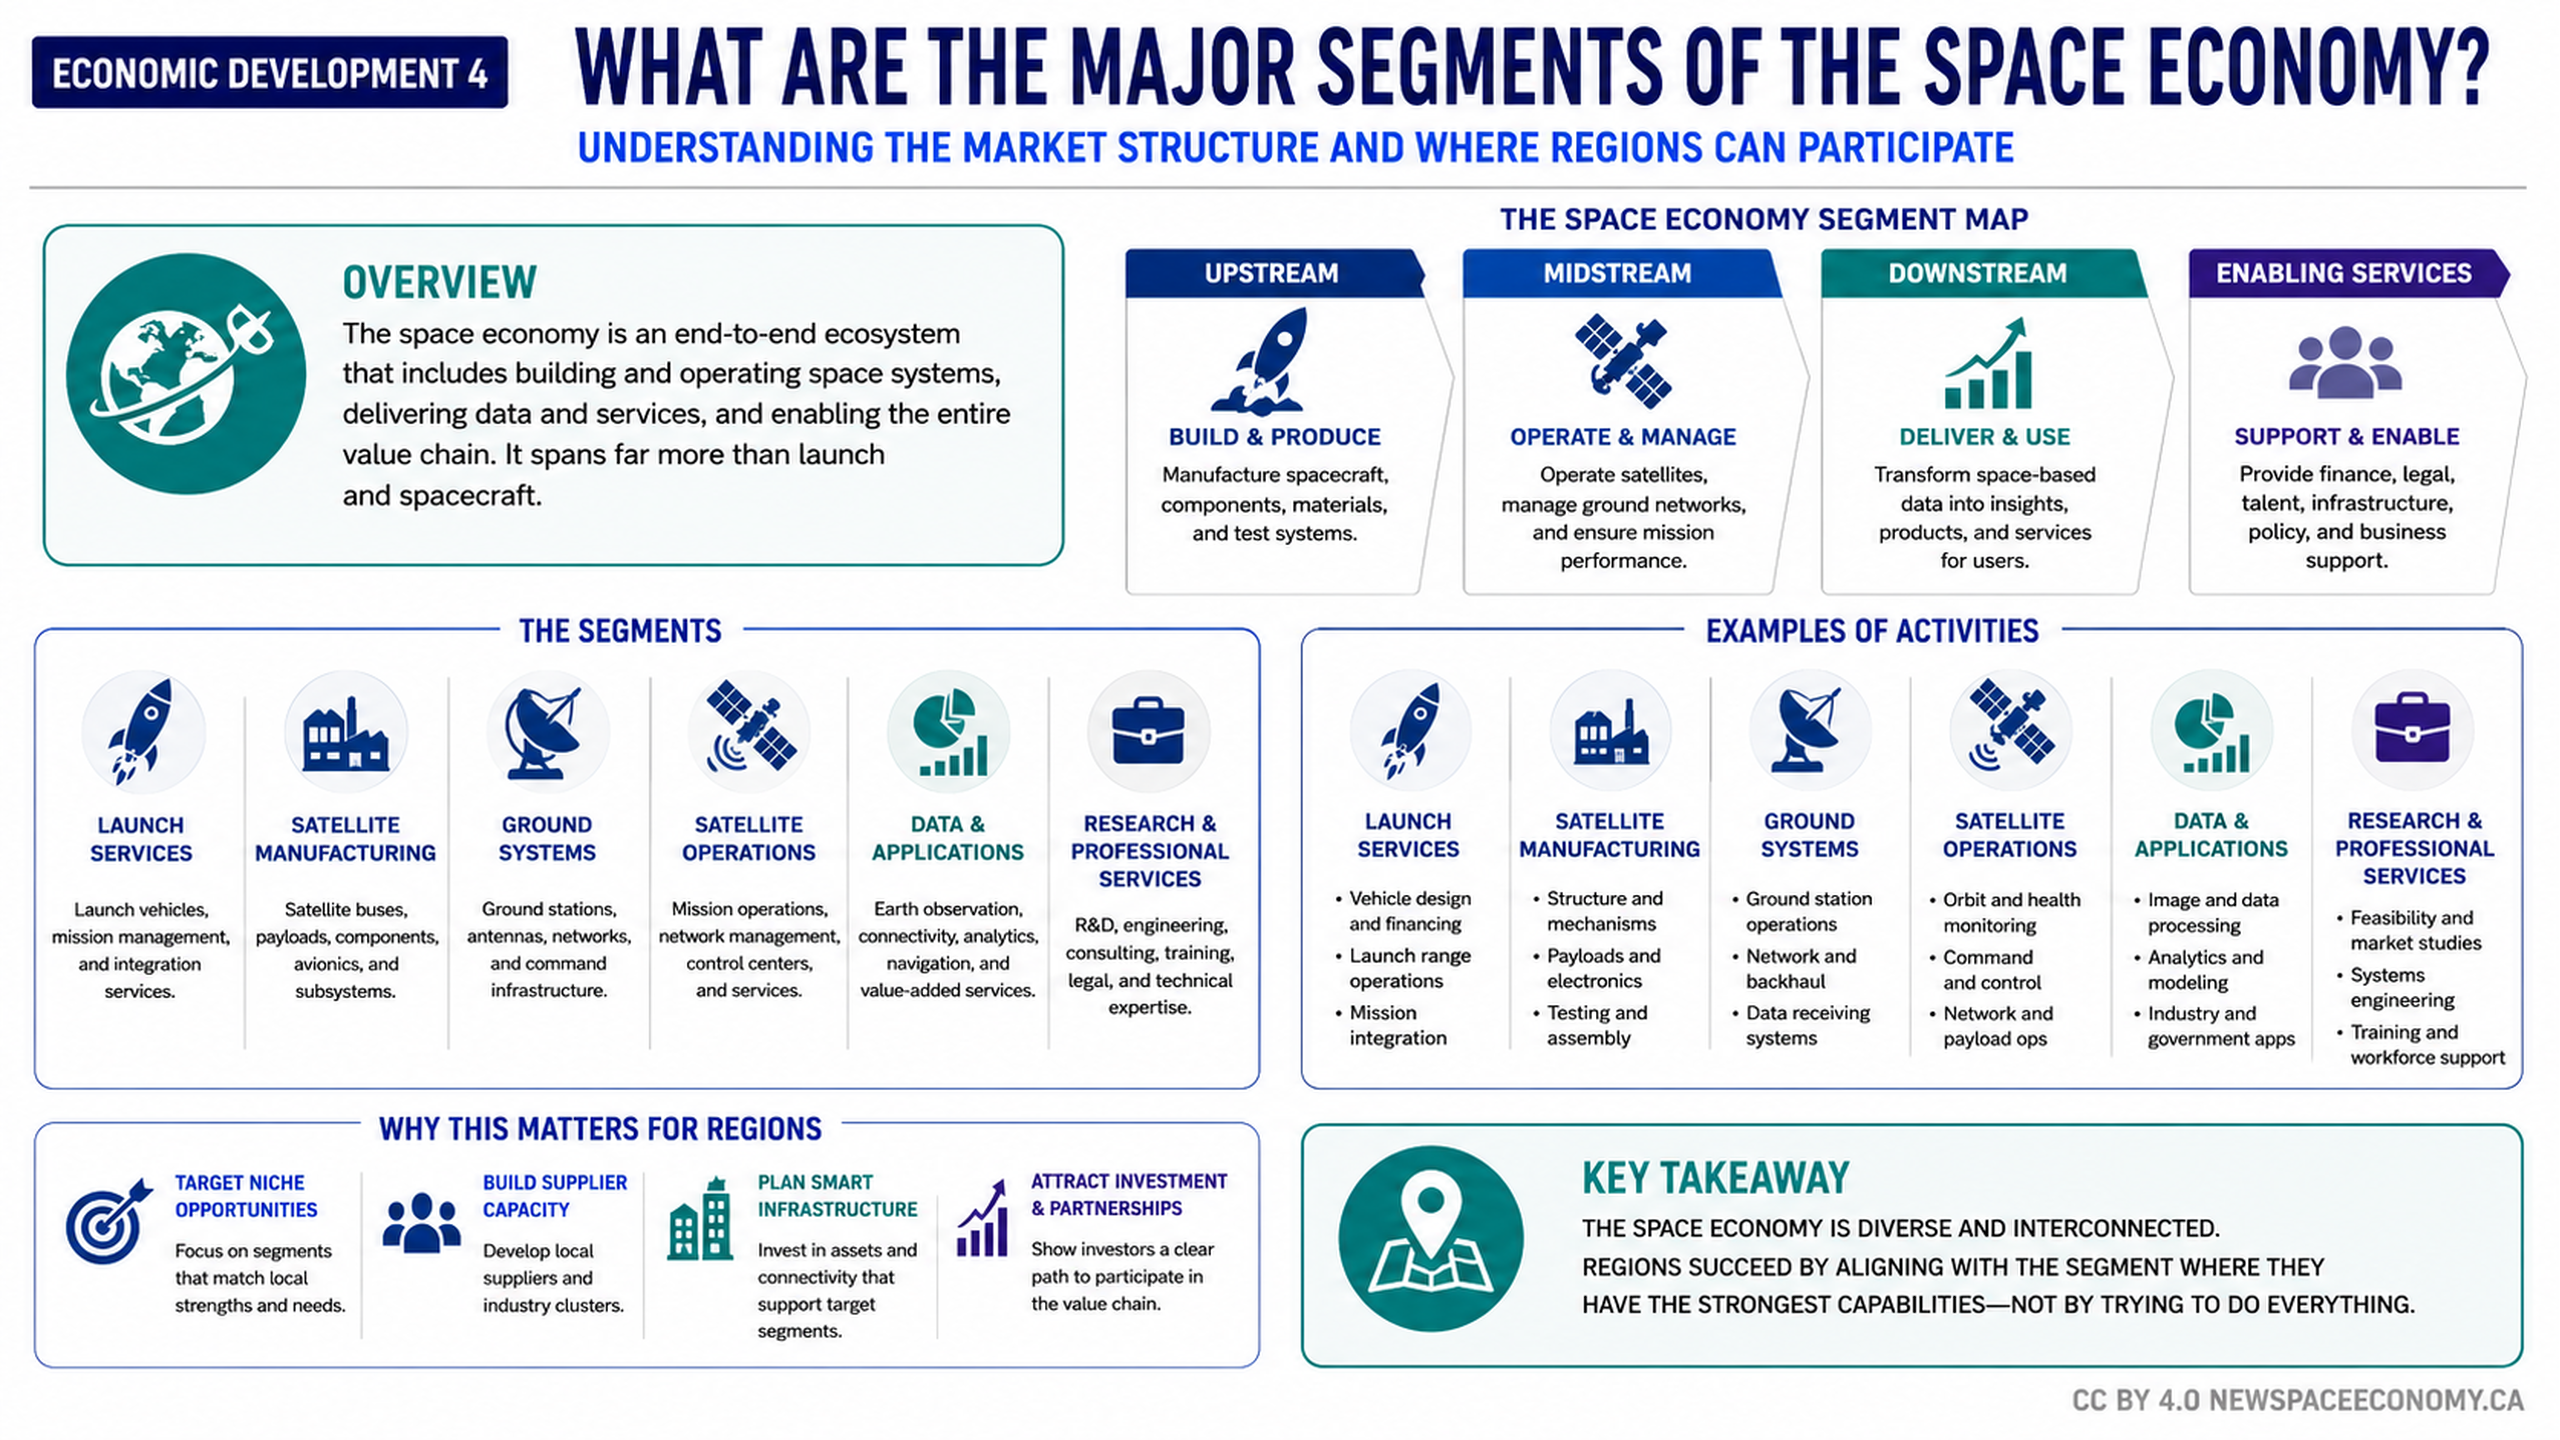
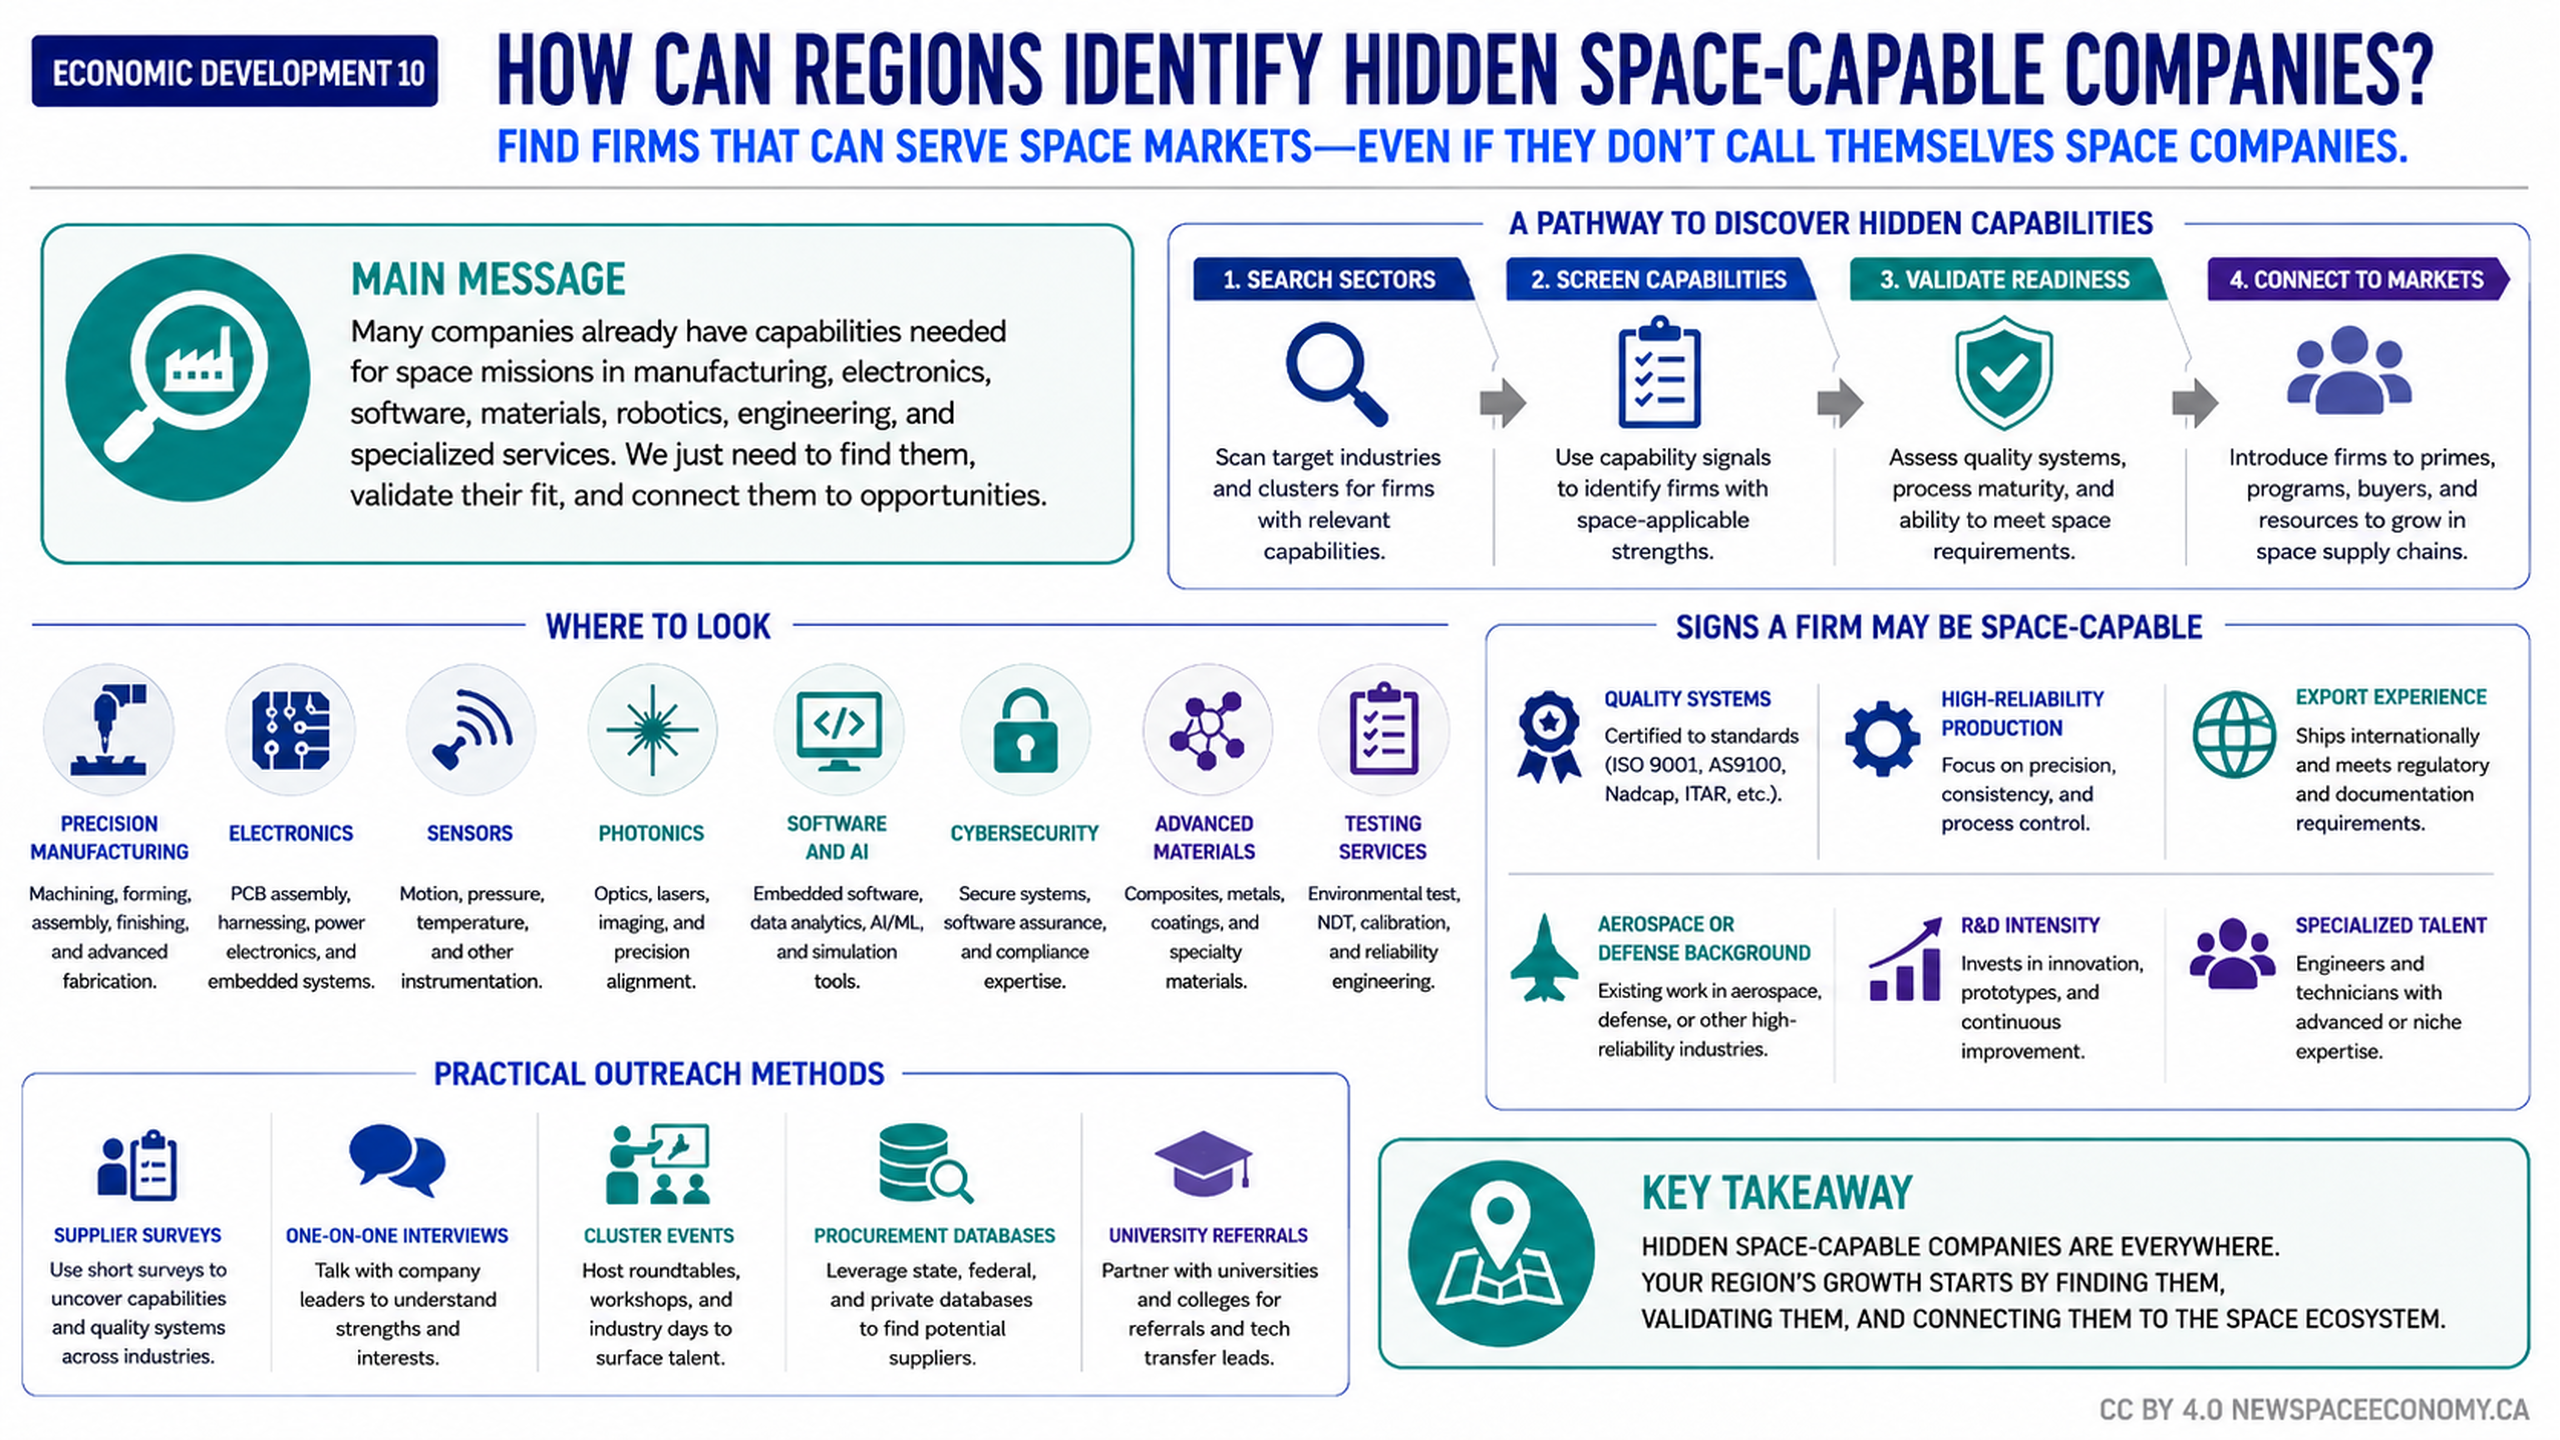
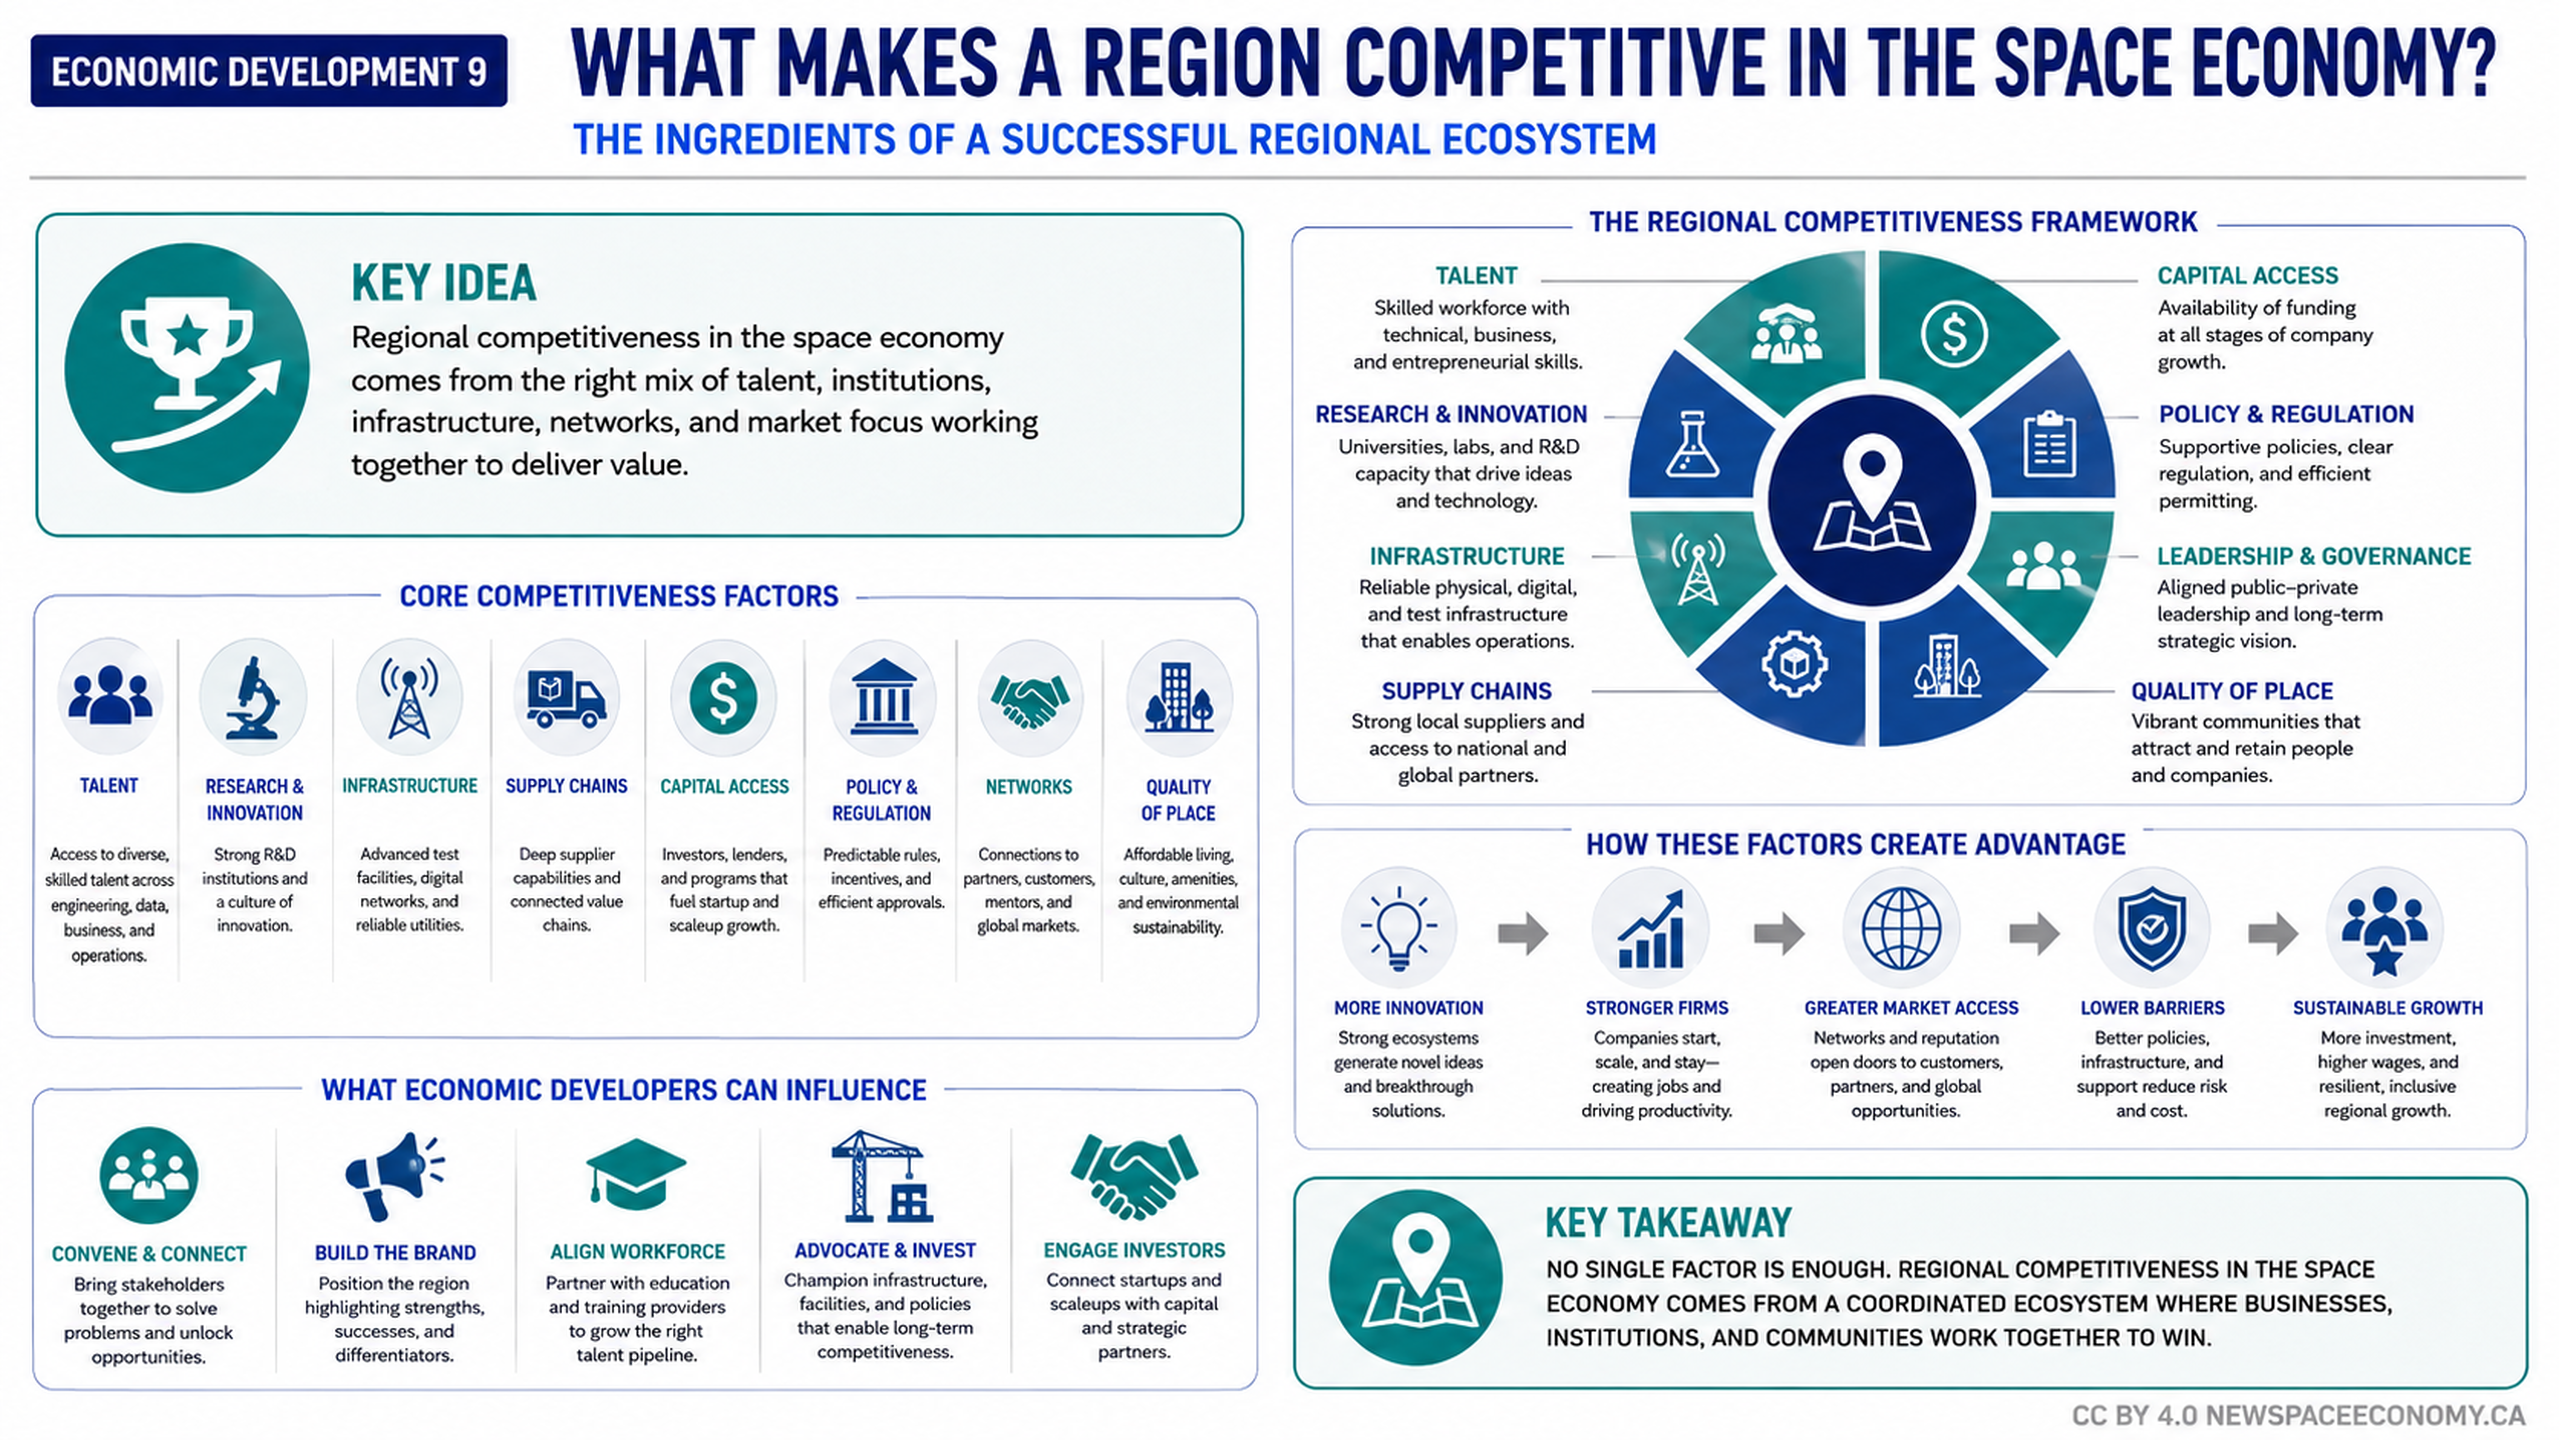
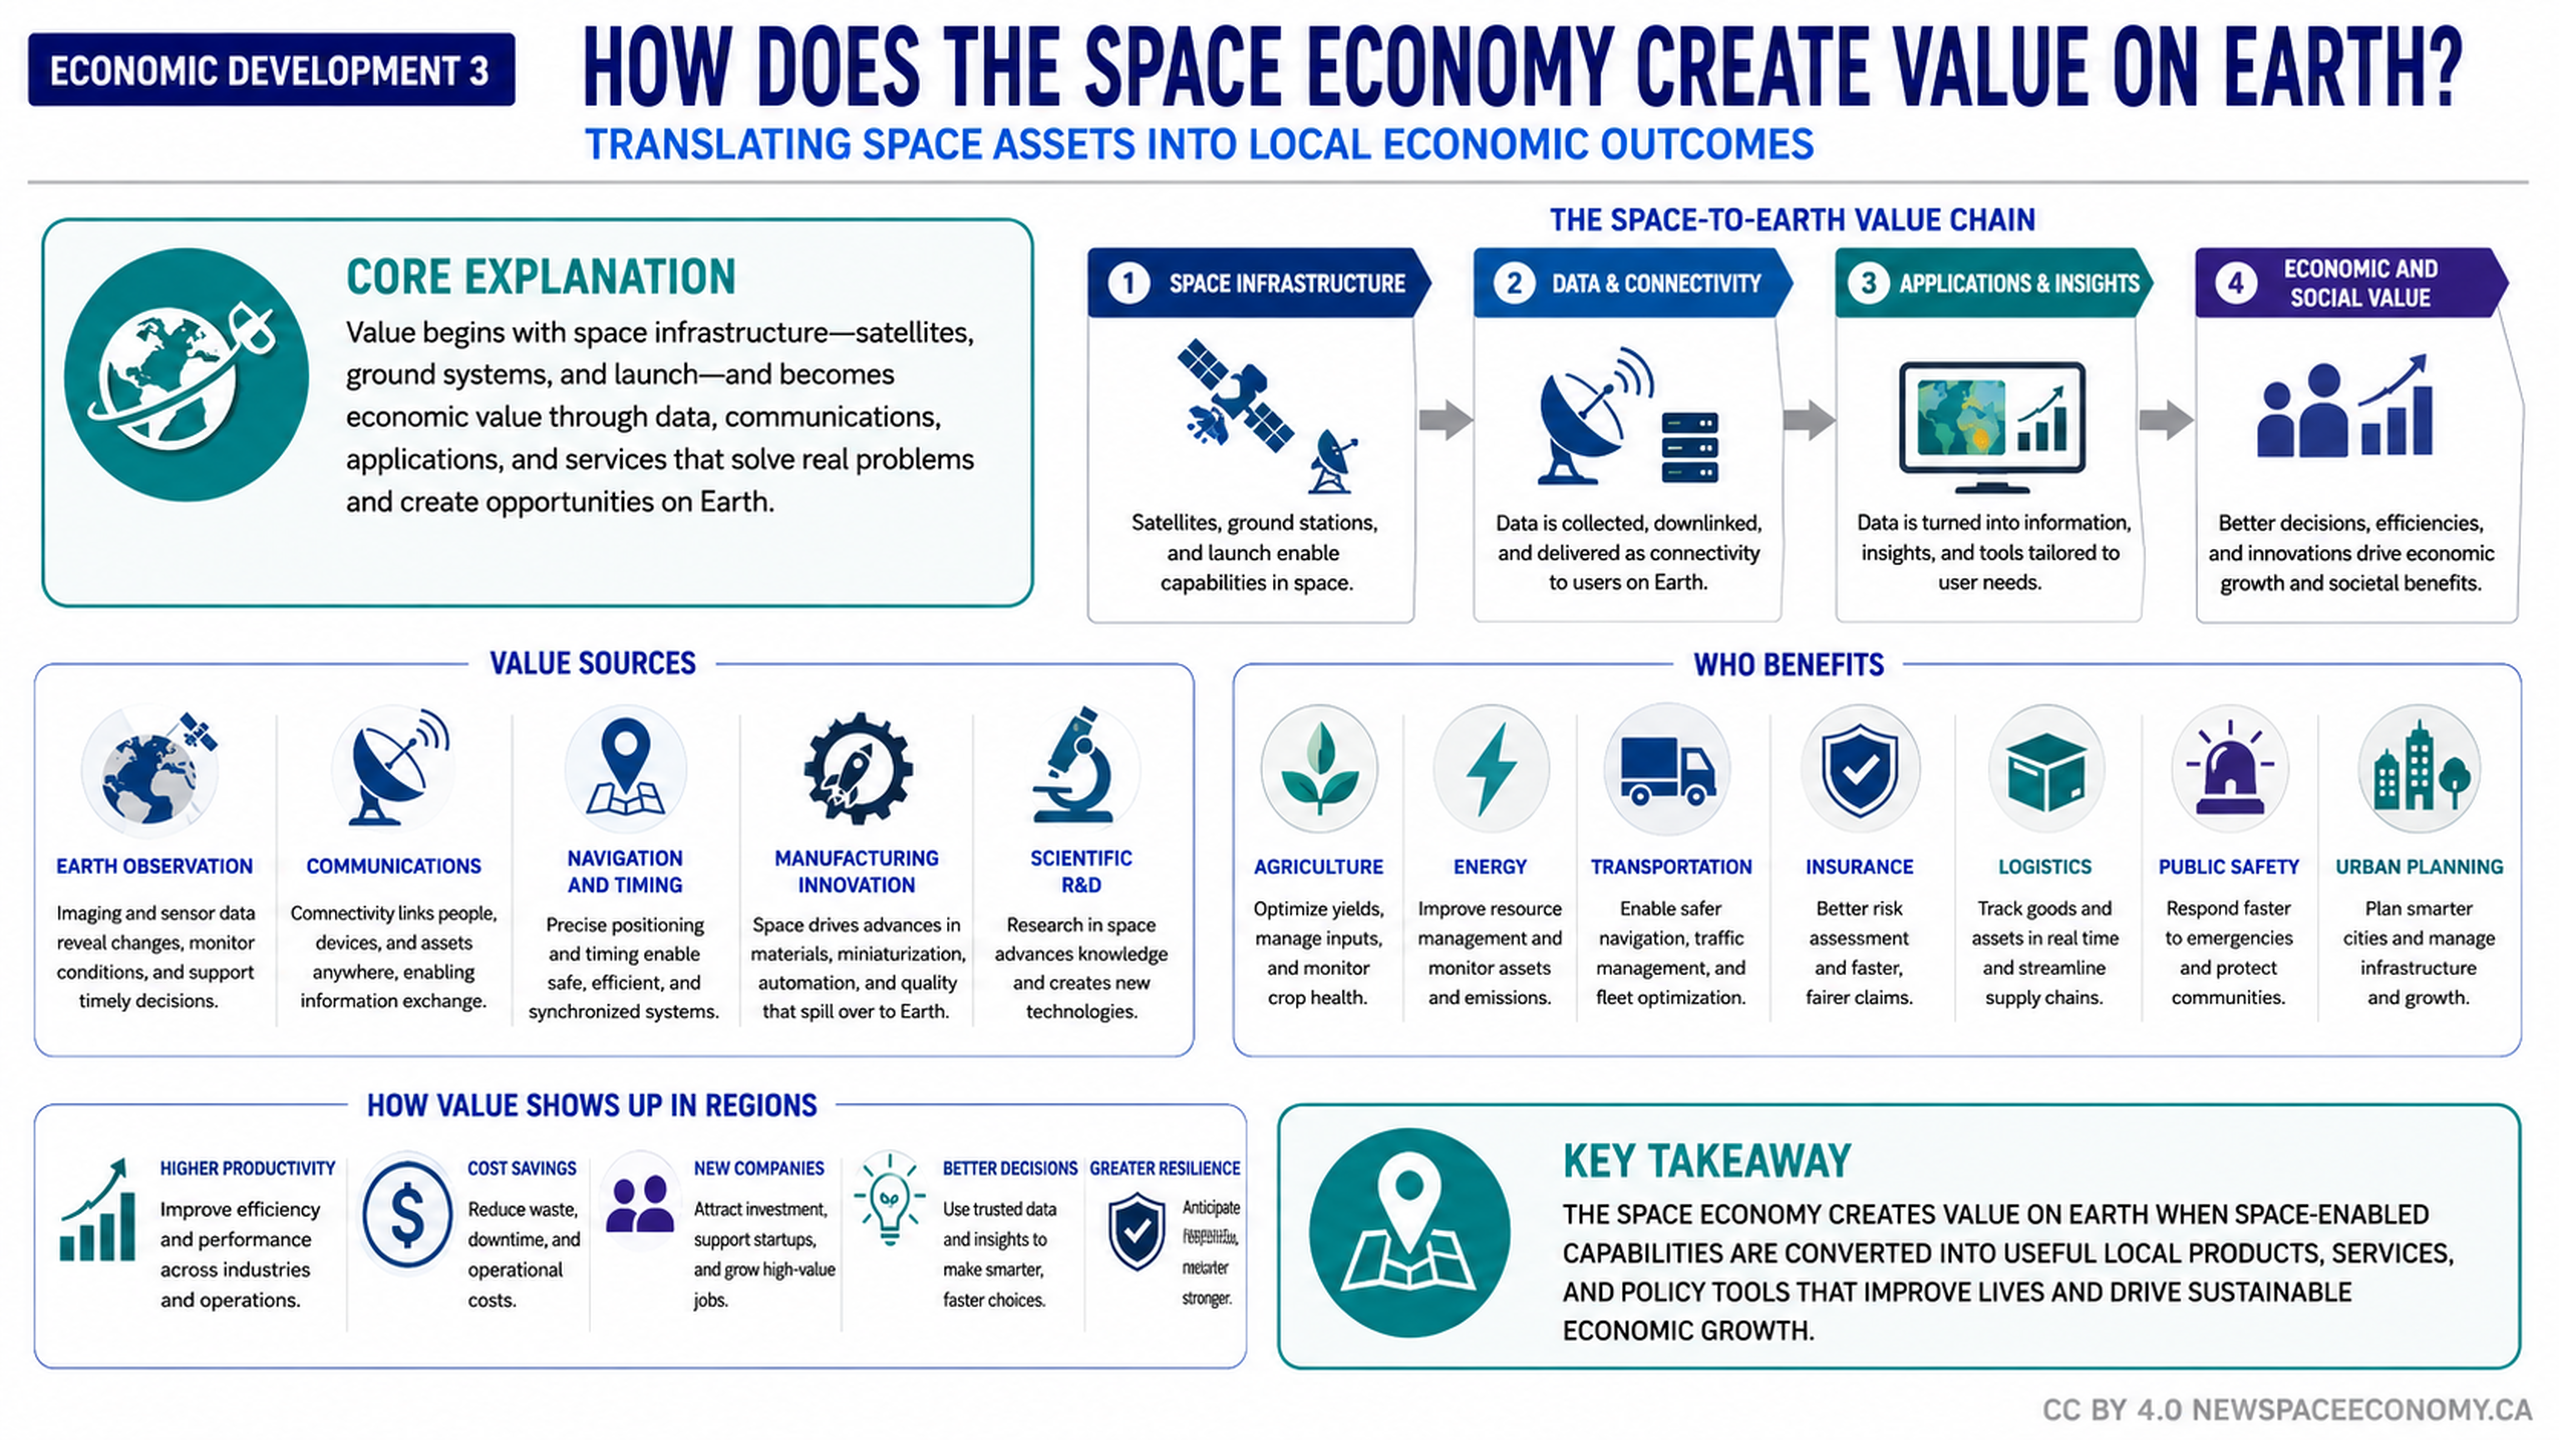
An infographic describes how satellite and sensor information can move through acquisition, delivery, processing, analytics, and digital services. It connects the data value chain with regional capabilities, economic benefits, common barriers, and practical actions for supporting sustainable local growth.

More From This Group