- Key Takeaways
- How Can Penguin Guano Turn a Satellite Image Into a Diet Measurement?
- What Does a Free Landsat Image Actually Cost to Turn Into Science?
- How Much Should Processing, Computing, and Interpretation Be Valued?
- How Does Satellite Analysis Compare With Antarctic Field Methods?
- What Is the Replacement Value of One Useful Satellite Observation?
- What Is the Value of the Full 1984-2013 Dataset?
- How Much Scientific Value Does the Dietary Information Create?
- What Does This Example Reveal About Earth Observation Economics?
- Summary
Key Takeaways
- A free Landsat scene can require hundreds of dollars in expert processing before yielding a diet estimate.
- A mature satellite workflow can still cost far less than sending researchers to an Antarctic penguin colony.
- Scientific value comes from scale, repeatability, and historical observations that cannot be recreated.
How Can Penguin Guano Turn a Satellite Image Into a Diet Measurement?
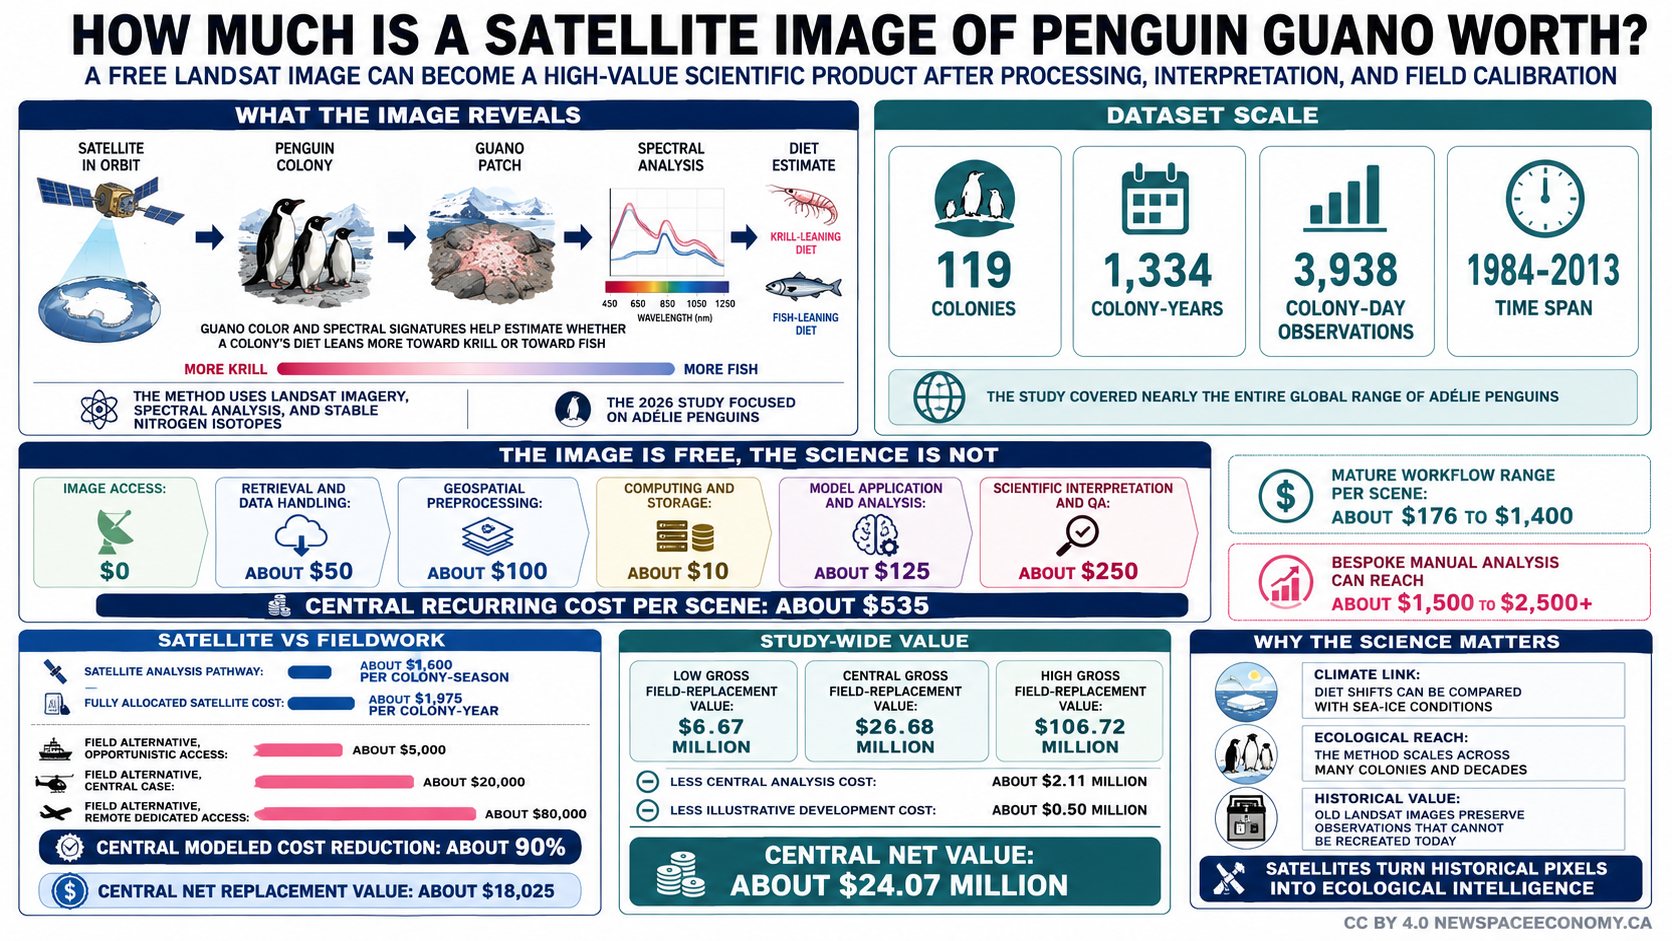
On July 20, 2026, Current Biology published a study showing that scientists could reconstruct decades of Adélie penguin dietary patterns from satellite observations of guano accumulated around Antarctic breeding colonies. The peer-reviewed penguin diet study combined Landsat imagery, imaging spectroscopy, stable-isotope measurements, and statistical modeling to examine dietary variation across almost the entire geographic range of the species from 1984 through 2013.
The result provides an unusually clear example of satellite image value because the original satellite observation is available to researchers without an imagery charge, yet obtaining related biological information through conventional Antarctic fieldwork can cost thousands or tens of thousands of dollars for each site visit.
The satellite does not identify shrimp-shaped krill or individual fish inside a penguin. It measures reflected electromagnetic energy from material on the ground. Penguin guano changes spectrally according to dietary composition, allowing calibrated measurements to distinguish broad differences between diets dominated by lower-trophic-level krill and diets containing more higher-trophic-level fish such as Antarctic silverfish.
The color difference is visible enough that NASA Earth Observatory describes krill-rich guano as producing pinkish or orange-red staining at colonies. The research method goes much further than visual inspection. Scientists measured the reflectance of physical guano samples and compared those spectral characteristics with stable nitrogen isotope values. Those isotope measurements provide information about trophic position because nitrogen isotope ratios change predictably as material moves through a food chain.
Once researchers established a statistical relationship between the spectral information and measured diet indicators, they could apply the model to satellite observations.
That distinction separates a photograph from a scientific information product.
A raw or lightly processed satellite scene contains measurements. A diet estimate requires calibrated sensor data, geospatial processing, quality filtering, identification of penguin-colony areas, extraction of relevant pixels, transformation of spectral variables, application of a validated statistical model, interpretation, uncertainty assessment, and documentation.
The economics of Earth observation often follow this progression. The New Space Economy satellite products guide distinguishes imagery from analytics and information products. Each stage adds labor, software, computing, domain expertise, quality control, and interpretation.
The penguin application demonstrates that distinction in a form that is easy to quantify. The acquisition price of a Landsat scene can be zero, yet the cost of converting it into reliable biological information is not zero. More important, neither of those amounts determines the scientific or economic value of the information produced.
The study’s scale makes the comparison unusually useful. Its dataset included 119 Adélie penguin colonies, 1,334 colony-years, 3,938 unique colony-days, and a very large collection of guano-containing pixels distributed across Antarctica. The temporal record extended across approximately three decades.
A conventional field project could provide richer information about individual animals, prey species, behavior, physiology, breeding condition, and local oceanography. Reproducing continent-scale dietary observations over three decades through field visits would present a radically different logistical problem.
The satellite image value arises from that difference in scale.
A single field sample can answer a highly specific biological question. Satellite observations can extend a calibrated relationship across places and historical periods that researchers did not physically sample at the time.
That creates four separate forms of value.
One is replacement value, meaning the cost of obtaining comparable information through another method.
Another is processing value, representing the human and computing resources required to convert imagery into usable scientific information.
A third is scientific information value, representing the added knowledge produced by greater geographic coverage, repeated observations, and larger sample sizes.
A fourth is historical option value, representing the possibility that archived observations can answer questions that scientists had not formulated when the data were originally collected.
That last category deserves more attention in space-economy analysis. Landsat has collected observations for decades. Improved algorithms, computing, field calibration, and statistical methods can convert old pixels into new scientific information. The Earth observation memory concept provides a broader example of how long-running orbital archives preserve measurements that can gain new analytical uses long after acquisition.
Penguin guano turns that abstract principle into something measurable.
An observation acquired in 1987 existed before this particular dietary technique had been demonstrated. The observation nevertheless preserved the spectral state of a penguin colony on that date. Researchers decades later could interrogate that record with methods that had matured long after the spacecraft passed overhead.
A field expedition cannot reproduce that capability.
Scientists can visit the same geographic location in September 2026. They cannot collect a fresh sample from the same penguins, sea-ice conditions, prey population, and breeding season that existed decades earlier.
The resulting satellite image value has no exact market price because one part of the information has no replacement market.
The monetary analysis can still estimate the costs that can be measured. Doing so requires accounting for the complete chain from orbital observation through scientific interpretation.
What Does a Free Landsat Image Actually Cost to Turn Into Science?
The United States Geological Survey provides Landsat data under a no-cost open-data policy. Researchers can obtain Landsat Collection 2 surface reflectance products without paying an image-access fee.
That zero-dollar price can create a misleading impression if the economic analysis stops at data acquisition.
The user receives a sophisticated product that already embodies government-funded satellite manufacturing, launch, operations, ground systems, calibration, archiving, atmospheric correction, quality assurance, software development, and data distribution. Those public-program costs are real, although they are not charged to each researcher when a scene is downloaded.
Collection 2 Level-2 products substantially reduce the amount of preprocessing required from individual users. USGS generates atmospherically corrected surface reflectance products and provides quality bands that help users identify clouds, radiometric saturation, terrain effects, and other conditions affecting interpretation.
USGS describes Collection 2 products as analysis-ready data. That does not mean a biological conclusion automatically emerges after download.
For a penguin-diet application, work remains after USGS processing.
A research workflow may need to locate appropriate scenes, check acquisition dates, screen cloud and snow conditions, associate observations with known colony boundaries, select the correct spectral bands, exclude unsuitable pixels, standardize measurements among Landsat sensor generations, extract guano reflectance, apply a calibration model, calculate uncertainty, inspect anomalous outputs, merge environmental information such as sea-ice conditions, and generate a scientifically defensible result.
Computers can automate much of this work. Expert labor remains the largest downstream cost in many research settings.
The economics can be expressed as:
Total Satellite-Derived Observation Cost = Imagery Access + Data Handling + Processing + Computing + Scientific Interpretation + Quality Control + Method Development Allocation
Imagery access for Landsat is $0.
The remaining categories must be estimated.
A mature operational workflow is different from a scientist developing the method for the first time. Once code, colony boundaries, calibration equations, processing scripts, validation procedures, and documentation already exist, processing another suitable image can be inexpensive. Building those components from scratch requires far more scientific labor.
That produces two cost categories that should never be mixed indiscriminately.
Recurring processing costs occur each time another image or observation enters the workflow.
Method-development costs occur when researchers design, calibrate, validate, test, document, and publish the analytical method.
The distinction is similar to the economics of software. Writing an analytical program can cost hundreds of thousands of dollars. Running that program once after development may cost a few dollars in computing and a modest amount of analyst review.
Satellite science behaves similarly.
The direct computational burden of processing a Landsat scene for a limited-area spectral analysis is modest by contemporary computing standards. Surface reflectance imagery does not require a supercomputer merely to extract a colony-sized set of pixels. A modern workstation or ordinary cloud instance can perform basic raster operations, spectral calculations, masking, subsetting, and model inference.
Computing becomes more expensive when researchers process large archives, run repeated simulations, execute hierarchical statistical models, maintain cloud storage, build reproducible pipelines, perform uncertainty analysis, or repeatedly reprocess data during method development.
Even then, labor commonly outweighs raw processor time.
The U.S. Bureau of Labor Statistics reported a 2025 median wage of $120,230 for data scientists and $140,300 for computer and information research scientists. These figures correspond to direct wages rather than the full cost that universities, laboratories, companies, or government organizations incur when employing specialists.
An employer’s effective hourly cost may include salary, benefits, payroll charges, equipment, office or laboratory infrastructure, information technology, supervision, administration, leave, and institutional overhead.
For modeling the penguin application, a fully loaded specialist rate between $80 and $200 per hour is a reasonable planning range rather than a published price for this particular study.
A central working assumption of $125 per specialist hour provides a useful basis for estimating satellite image value.
A mature single-scene workflow might require approximately:
- 15 to 45 minutes for scene discovery, metadata checking, and retrieval
- 15 to 60 minutes for quality screening, masking, and subsetting
- 15 to 60 minutes for spectral extraction and model execution
- 30 to 120 minutes for scientific review and interpretation
- 15 to 60 minutes for documentation, anomaly handling, and output validation
These estimates represent modeled analyst effort. They are not reported labor records from the 2026 penguin study.
Automation could reduce the effort below this range when hundreds of scenes pass through the same established pipeline. A difficult scene affected by cloud, mixed pixels, unusual surface conditions, sensor differences, or uncertain colony boundaries could require substantially more attention.
The table organizes a plausible recurring cost stack for converting one suitable Landsat scene into research-grade information.
| Cost Component | Modeled Range per Scene | Central Estimate |
|---|---|---|
| Landsat Imagery Access | $0 | $0 |
| Retrieval and Data Handling | $20-$100 | $50 |
| Geospatial Preprocessing | $40-$250 | $100 |
| Computing and Storage | $1-$50 | $10 |
| Model Application and Analysis | $40-$300 | $125 |
| Scientific Interpretation and QA | $75-$700 | $250 |
| Total Recurring Processing Cost | $176-$1,400 | $535 |
Rounding that central result gives approximately $500 to $600 per suitable scene for a mature research workflow in which the methodology already exists.
A highly automated batch pipeline could reduce marginal cost below $200 for uncomplicated observations. A bespoke image requiring manual masking, additional calibration work, repeated processing, and senior scientific interpretation could cost $1,500 to $2,500 or more.
Those numbers provide a more complete basis for assessing satellite image value.
The image may be free.
The scientific observation is not.
How Much Should Processing, Computing, and Interpretation Be Valued?
Processing costs need to be divided by function because the word “processing” can refer to activities performed by completely different organizations.
USGS performs much of the upstream work before the researcher receives a Level-2 product. Sensor calibration, geolocation, atmospheric correction, quality bands, product generation, archive management, and distribution belong to the Landsat infrastructure.
Researchers then perform application-specific downstream processing.
That downstream layer is where satellite imagery becomes penguin dietary information.
The New Space Economy downstream market analysis describes a similar economic progression in commercial Earth observation. Value frequently moves from raw data toward analysis-ready products, analytics, software, and decision-support outputs.
The same logic applies to science even where no commercial customer buys the output.
Data Discovery and Selection
A researcher must determine which observations are scientifically useful. Date, season, solar geometry, cloud cover, sensor generation, colony location, image quality, and overlap with known guano areas can all matter.
Automated catalog searches can narrow the candidate pool quickly. Human review may still be necessary when a scene sits near an acceptance threshold.
For one image in a mature workflow, this work may cost only $20 to $100 in analyst time.
Across decades of imagery and more than 100 colonies, scene selection becomes a research task of its own. Poor selection can introduce bias. If clear-weather observations occur more frequently under certain conditions, the selection process can affect the resulting statistical record.
Image Preprocessing and Quality Control
Collection 2 removes much of the burden that earlier Landsat researchers had to carry themselves. USGS supplies atmospherically corrected surface reflectance and quality-assessment information.
Application-specific work can still include reprojection, subsetting, cloud screening, snow or ice masking, sensor harmonization, colony-boundary intersection, pixel filtering, and removal of observations that fail quality criteria.
A central estimate of approximately $100 per scene assumes less than one hour of specialist attention combined with automated scripts.
Manual correction can increase this figure several times.
The cost should not be confused with raw computing. Most of the expense comes from deciding whether the processing result makes scientific sense.
Spectral Feature Extraction
The pipeline must convert multispectral pixels into variables compatible with the dietary calibration model.
Once the code exists, arithmetic on several Landsat bands is computationally inexpensive. Reading files, calculating spectral features, selecting pixels, and applying regression or hierarchical model outputs can happen quickly.
The associated labor is still real because scripts need to be executed, monitored, versioned, and checked.
A modeled range of $40 to $300 per scene covers cases from automated execution through more intensive analytical work.
Computing Cost
Computing receives considerable attention in discussions of satellite analytics, but for this specific application it is unlikely to dominate the recurring cost of an individual image.
A Landsat scene is manageable on an ordinary workstation. Colony-level subsets are much smaller.
Local processing uses electricity, storage, workstation depreciation, backup capacity, and maintenance. Cloud processing substitutes metered computing and storage charges.
For one scene, $1 to $50 is a reasonable broad infrastructure allowance for the type of computation required here.
The lower end represents a local or already-funded research environment in which marginal processor and storage costs approach zero.
The upper end allows for cloud execution, storage, data movement, repeated runs, workflow services, and less efficient analysis.
Research-scale statistical modeling can consume more computing, particularly when many observations are fitted simultaneously. Those costs belong partly to project-level analysis rather than the recurring processing of one image.
This matters for the satellite image value calculation because assigning hundreds of dollars of supercomputer time to every Landsat scene would exaggerate the actual cost of the application.
Scientific Interpretation
Interpretation is likely the largest recurring cost.
An algorithm can output a dietary index. A scientist must decide whether that value is credible.
The analyst may compare the result with known colony conditions, inspect suspect pixels, evaluate uncertainty, check whether the observation falls outside the range represented by calibration data, compare adjacent dates, identify mixed surface materials, and decide whether the measurement belongs in the scientific dataset.
Those actions require knowledge of remote sensing, Antarctic biology, statistics, or some combination.
A central estimate of $250 per scene corresponds to approximately two hours of specialist review at a fully loaded cost near $125 per hour.
Difficult observations could require considerably more work.
Documentation and Reproducibility
Published science requires records that allow researchers to understand what happened to the data.
Scripts must be stored. Software versions matter. Processing parameters must be recorded. Exclusion rules need consistency. Derived outputs need traceability to original observations.
These activities can appear administrative, but weak documentation reduces the scientific value of the result because later researchers cannot confidently reproduce or reinterpret it.
Some of this cost is included within the scientific interpretation estimate. A large project may assign dedicated data-management or software-engineering resources.
One-Time Method Development
The recurring $500 to $600 central figure should never include the entire cost of inventing the penguin-diet method.
Method development likely required years of accumulated scientific knowledge, field sampling, laboratory work, code development, spectral analysis, statistical modeling, manuscript preparation, peer review, and institutional infrastructure.
The 2026 paper does not provide a project budget that would support a precise accounting figure.
A modeling exercise can still establish the likely scale.
Suppose development required the equivalent of 1,000 to 3,000 specialist hours across field biology, remote sensing, statistical analysis, software development, data management, and scientific supervision.
At fully loaded rates of $100 to $200 per hour, labor alone could represent $100,000 to $600,000.
Add field calibration, travel, sample collection, stable-isotope laboratory work, instrumentation, institutional support, and computing, and a plausible method-development envelope could rise to $250,000 to more than $1 million.
Those figures are planning estimates, not claimed expenditures by the authors.
An illustrative midpoint of $500,000 is useful for amortization.
If that one-time development cost supported 3,938 colony-day observations, the development allocation would be about:
$127 per colony-day.
Spread over 1,334 colony-years, it would equal:
about $375 per colony-year.
Future observations generated with the same validated method would reduce the amortized cost further.
This is how scale changes Earth-observation economics.
A research method can be expensive to invent and inexpensive to repeat.
The following cost stack separates development from recurring analysis.
| Cost Layer | What It Includes | Illustrative Cost |
|---|---|---|
| Raw Imagery Access | Landsat Data Retrieval | $0 |
| Upstream Public Processing | Calibration, Geolocation, Surface Reflectance, Archive | No User Charge |
| Recurring Downstream Analysis | Selection, Processing, Compute, Interpretation, QA | $500-$600 per Scene |
| Bespoke Scene Analysis | Manual Processing and Senior Review | $1,500-$2,500+ |
| Method Development | Calibration, Models, Validation, Software, Field Support | ~$250,000-$1 Million+ |
The central lesson for satellite image value is that downstream processing should be counted, but it does not erase the cost advantage created by remote sensing.
A $0 image transformed by $500 of specialist work can still replace a much more expensive field observation.
How Does Satellite Analysis Compare With Antarctic Field Methods?
A conventional penguin-diet study can use direct observations, stomach contents, prey remains, guano chemistry, stable isotopes, DNA analysis, animal-borne instruments, or combinations of these methods.
Each provides different information.
Satellite spectroscopy does not replace every field technique. It answers a narrower question at much greater geographic and temporal scale.
The economic comparison should use the next-best method capable of producing sufficiently similar information, rather than comparing satellite imagery with the most elaborate biological expedition imaginable.
For broad krill-versus-fish dietary information, physical guano collection followed by stable-isotope analysis provides a sensible benchmark.
Laboratory isotope analysis itself can be inexpensive relative to Antarctic logistics. The sample must still reach a laboratory.
Scientists need access to the colony. That may require an ice-capable vessel, research station support, helicopter or aircraft transport, small boats, field personnel, protective equipment, communications, safety procedures, permits, sample containers, preservation, transportation, and scientific staff time.
A colony near an existing research station or a site already included in an expedition schedule may be comparatively inexpensive.
A remote colony requiring dedicated vessel operations can be very expensive.
This means no scientifically defensible universal price exists for “measuring one penguin colony.”
The earlier replacement-value estimate of $5,000 to $80,000 or more per colony-season remains useful if explicitly labeled as an illustrative model.
The $5,000 scenario represents opportunistic access. An expedition is already visiting the area, and the diet project pays only incremental personnel, sampling, laboratory, and associated logistical costs.
The $20,000 scenario assigns a meaningful share of transport and research support to the dietary measurement.
The $80,000 scenario represents remote access in which a substantial fraction of a polar vessel day or comparable logistical effort is attributable to obtaining the observation.
Those estimates describe a colony-season, not necessarily one physical sample.
A field team may collect multiple samples during a visit. Satellite analysis may use multiple acquisition dates to characterize the same colony-season.
The comparison becomes more realistic when downstream processing is added to the satellite side.
Suppose a useful colony-season estimate requires approximately three satellite acquisition dates. The 2026 dataset contained 3,938 colony-days across 1,334 colony-years, equal to an average of roughly 2.95 observed colony-days per colony-year.
Using three observations as a simplified central assumption produces the following calculation:
Three Scenes × $535 Processing per Scene = $1,605
Rounded for uncertainty:
approximately $1,500 to $1,800 per colony-season
That is the cost of converting free imagery into research-grade information under the central processing model.
The comparison with field alternatives becomes:
- Opportunistic field method: approximately $5,000
- Satellite processing pathway: approximately $1,600
- Modeled saving: approximately $3,400, or 68%
For the central field scenario:
- Field method: approximately $20,000
- Satellite pathway: approximately $1,600
- Modeled saving: approximately $18,400, or 92%
For the remote-access scenario:
- Field method: approximately $80,000
- Satellite pathway: approximately $1,600
- Modeled saving: approximately $78,400, or 98%
These figures should not be interpreted as a claim that the satellite method produces every piece of information a field expedition could collect.
It does not.
The comparison asks a narrower economic question: how much would it cost to obtain broadly comparable colony-level dietary information?
The table shows the net comparison after including interpretation, processing, computing, and analysis.
| Scenario | Field Cost | Satellite Analysis Cost | Modeled Saving |
|---|---|---|---|
| Opportunistic Access | $5,000 | $1,600 | $3,400 / 68% |
| Central Research Case | $20,000 | $1,600 | $18,400 / 92% |
| Remote Dedicated Access | $80,000 | $1,600 | $78,400 / 98% |
The low-cost scenario deserves attention because it prevents exaggeration.
If researchers are already standing beside the colony for another project, satellite analysis may not save tens of thousands of dollars. Physical sampling could be economically attractive and scientifically richer.
The satellite advantage grows as sites become more remote, sample counts increase, observations need repetition, or research covers multiple decades.
There is another efficiency that makes the simple three-scenes-per-colony calculation conservative.
A Landsat scene covers a very large geographic footprint. A single acquisition may contain more than one relevant colony. Once the processing pipeline loads the image, extracting information from another colony inside the same scene may require little extra computing.
Per-colony costs can consequently fall below the per-scene cost.
Batch processing also reduces labor. An analyst does not need to manually download 1,000 scenes, open each file, calculate every feature by hand, and save every result separately. Scripts can perform repetitive work and send only questionable cases for human review.
At sufficient scale, the marginal cost of another observation approaches the cost of computing plus exception handling.
That is one reason open Earth observation data can create downstream economic value even when the data provider does not charge for the underlying imagery.
The data removes one barrier.
Automation removes another.
Expert interpretation remains the bridge between pixels and defensible conclusions.
What Is the Replacement Value of One Useful Satellite Observation?
The phrase “one satellite image” can mean several different economic units.
A Landsat file is one unit.
A colony observed on one date is another.
A colony-season estimate may combine several dates.
A scientific paper can combine thousands of observations.
The satellite image value changes according to which unit is being measured.
For a single suitable Landsat scene processed through an established penguin-diet workflow, the central recurring analytical cost is approximately $535, rounded to about $500 to $600.
The value of that output depends on what it replaces.
If the scene produces useful dietary information that would otherwise require a $20,000 Antarctic field campaign, its gross replacement value is $20,000.
Subtract approximately $535 for interpretation and processing:
Net economic advantage = $19,465
That corresponds to a value-to-processing-cost ratio of approximately:
$20,000 / $535 = 37.4
A research organization receives roughly $37 of field-equivalent information for each $1 spent turning that particular satellite scene into a scientific product under those assumptions.
This ratio declines when a colony-season requires multiple satellite dates.
Using three processed observations:
Satellite analysis cost = approximately $1,605
Compared with a $20,000 field alternative:
Gross replacement ratio = 12.5 to 1
The modeled net saving remains about $18,395.
Under a $5,000 opportunistic field scenario, the ratio is only about 3.1 to 1 before considering differences in scientific content.
Under an $80,000 remote-field scenario, the ratio approaches 50 to 1.
Satellite image value is consequently highly location-dependent.
The same Landsat pixel has a greater replacement value when the ground location is costly, dangerous, inaccessible, politically restricted, or historically unreachable.
Antarctica combines several of those characteristics.
The earlier USGS Landsat economic valuation provides another useful benchmark. The 2023 Landsat valuation placed direct Landsat value at approximately $25.63 billion for 2023, based on approximately 65.6 million scene-equivalents accessed by users. USGS described an average scene-equivalent value near $390 under its valuation methodology.
That $390 figure should not be interpreted as a fixed market price.
It averages many uses together.
A particular scientific scene capable of avoiding an Antarctic expedition can have a much higher application-specific replacement value.
The penguin case illustrates why averages can conceal the economics of high-value observations.
A satellite image of a location that is inexpensive to inspect may provide modest avoided cost.
The same instrument observing a remote Antarctic colony, active volcano, disaster area, conflict zone, offshore installation, large agricultural region, or inaccessible ice sheet can replace expensive physical access.
Processing cost usually changes much less than field-access cost.
That asymmetry drives satellite economics.
Suppose one analyst can process and validate a suitable scene for $535.
The cost remains in approximately the same range whether the colony sits near a research station or hundreds of kilometers from routine field operations.
The cost of physically reaching those locations can differ by an order of magnitude.
Satellites flatten geography economically.
They do not eliminate all location-related limitations. Clouds, solar illumination, sensor resolution, revisit interval, terrain, snow, mixed pixels, and spectral ambiguity still determine whether an observation is useful.
When a suitable observation exists, the cost of accessing it from a computer bears little relationship to the physical difficulty of reaching the location on Earth.
That feature produces much of the satellite image value in environmental science.
A complete valuation can be expressed as:
Net Satellite Information Value = Avoided Field Cost – Image Acquisition Cost – Downstream Processing Cost
For Landsat:
Image Acquisition Cost = $0 to the user
Using the central colony-season assumptions:
Avoided Field Cost = $20,000
Downstream Processing Cost = approximately $1,600
Net Replacement Value = approximately $18,400
That figure excludes method-development cost.
If a $500,000 one-time development cost is amortized across 1,334 colony-years, add about $375 per colony-year:
Fully Allocated Satellite Cost = approximately $1,975 per colony-year
The resulting central net replacement value becomes:
$20,000 – $1,975 = $18,025
The satellite pathway still costs about 90% less under the central comparison.
The economics improve as the method produces additional observations beyond the original dataset, because the development cost gets spread across a larger denominator.
That is the scalable element of remote sensing.
Once a scientific relationship has been validated, an archive containing millions of past images becomes a potential source of additional measurements.
What Is the Value of the Full 1984-2013 Dataset?
The 2026 research reconstructed Adélie penguin dietary information over approximately three decades.
Scaling from a single colony-season to the complete dataset produces larger numbers, but it also requires more careful accounting.
A simple replacement-cost calculation multiplies the 1,334 colony-years by an estimated field cost.
At $5,000 each:
1,334 × $5,000 = $6.67 million
At the $20,000 central assumption:
1,334 × $20,000 = $26.68 million
At $80,000:
1,334 × $80,000 = $106.72 million
Those figures represent gross field-replacement value.
Processing should now be subtracted.
Using 3,938 colony-day observations and assuming a central fully processed per-observation allocation of $535 would generate about $2.11 million of downstream analytical cost.
That calculation is intentionally conservative because a colony-day is not necessarily equivalent to a separate complete Landsat scene requiring an independent $535 processing cycle. One scene can contain multiple colonies, scripts can batch observations, and automated processing reduces marginal labor.
A more efficient production-scale workflow could reduce the average per colony-day to $100 to $300 after method development.
At $200 each:
3,938 × $200 = $787,600
Add the illustrative $500,000 method-development allocation:
Total analytical and development cost = approximately $1.29 million
Under that mature batch-processing scenario, the $26.68 million central field-replacement value would produce:
Net replacement value = approximately $25.39 million
Use a more conservative $535 recurring processing allocation for every colony-day:
Recurring analysis = approximately $2.11 million
Add $500,000 method development:
Total satellite-side scientific processing = approximately $2.61 million
The net central replacement value becomes:
$26.68 million – $2.61 million = approximately $24.07 million
Both approaches leave a large positive difference.
The table presents low, central, and high valuation cases using conservative satellite-analysis assumptions.
| Scenario | Field Value | Analysis Cost | Development Cost | Net Value |
|---|---|---|---|---|
| Low | $6.67 Million | $0.79 Million | $0.25 Million | $5.63 Million |
| Central | $26.68 Million | $2.11 Million | $0.50 Million | $24.07 Million |
| High | $106.72 Million | $5.51 Million | $1.00 Million | $100.21 Million |
These are economic scenarios, not audited costs of the study.
Their purpose is to show what happens when downstream image analysis is incorporated into the earlier replacement-value model.
The answer changes, but the order of magnitude does not.
Under the central scenario, the gross replacement value falls from approximately $26.7 million to roughly $24 million after a conservative allowance for processing and method development.
The method still produces an order of magnitude more field-equivalent value than its modeled downstream analytical cost.
A deeper limitation appears when valuing the historical record.
The $5,000, $20,000, and $80,000 field scenarios assume that another method exists.
For historical observations, that assumption fails.
A researcher can estimate what it might have cost to station teams at 119 colonies year after year between 1984 and 2013. Researchers in September 2026 cannot purchase those missing historical observations if they were never collected.
The temporal dimension is irrecoverable.
This makes a conventional replacement-value formula incomplete.
Economists sometimes distinguish replacement value from option value. An archive creates the option to conduct analyses that have not yet been conceived.
Landsat observations can support new applications decades after acquisition because the measurement remains available.
A data archive is consequently not exhausted after one use.
The same image can contribute to geological mapping, ice studies, habitat analysis, coastal change, vegetation monitoring, disaster research, land-cover analysis, and biological studies without physically consuming the underlying observation.
That reuse means the penguin application should not bear the full cost of the satellite program.
The satellite already existed for many public purposes.
The penguin research represents an incremental scientific return from infrastructure whose measurements can be reused.
This characteristic differs from many field measurements.
A vessel trip to collect penguin guano may support multiple experiments, but researchers cannot reuse that same trip to observe a different location that the ship never visited.
A satellite archive can often be reanalyzed globally without launching another spacecraft.
The satellite image value accumulates as new uses emerge.
How Much Scientific Value Does the Dietary Information Create?
Dollar replacement cost captures only part of the benefit.
Scientific value also depends on what the information allows researchers to discover.
The 2026 study connected penguin diet with sea-ice conditions and long-term population patterns. Higher sea ice was associated with relatively more fish-based diets. Lower sea ice was associated with greater reliance on krill.
Those relationships matter because the observations connect physical environmental conditions with biological response.
Satellite systems have measured Antarctic ice for decades. Penguin dietary information adds another layer: how a predator’s food intake changes under different conditions.
A physical observation becomes linked to a biological process.
That expands the scientific question from “how much sea ice exists?” to “how might changing sea-ice conditions correspond with changes in the food web used by a major Antarctic predator?”
The scale of the satellite dataset creates statistical value.
A small field project may provide highly detailed data from one or several colonies.
A dataset spanning 119 colonies and 1,334 colony-years allows researchers to compare geographic patterns, repeated annual changes, regional differences, environmental relationships, and population associations.
Sample size does not automatically produce good science. Poorly calibrated large datasets can generate misleading precision.
The penguin method addresses that problem through physical sampling and stable-isotope calibration.
Field measurements provide biological grounding.
Satellite observations extend that calibrated relationship across space and time.
This combination makes the field and satellite approaches complements rather than complete substitutes.
Scientific value can be divided into several measurable dimensions.
Spatial value comes from the number and distribution of colonies observed.
Temporal value comes from repeated measurements across approximately 30 years.
Statistical value comes from thousands of colony-day observations.
Comparative value comes from using a consistent measurement framework across geographically separated sites.
Historical value comes from analyzing past conditions.
Monitoring value comes from the possibility of repeating the method as new observations become available.
Management value comes from connecting dietary patterns with questions concerning krill, predator populations, sea ice, and Antarctic marine-resource management.
The CCAMLR Ecosystem Monitoring Program already uses penguins and other krill-dependent predators as indicators. The Commission for the Conservation of Antarctic Marine Living Resources monitors biological parameters so changes in harvested species and environmental variability can be assessed.
Satellite dietary measurements could contribute another information stream to that broader scientific system.
They would not independently determine a fishery-management decision.
Diet is influenced by prey availability, prey quality, sea ice, geography, breeding stage, foraging behavior, oceanography, and other biological conditions. A krill-rich diet cannot automatically be interpreted as evidence of fishing pressure.
The scientific value comes from adding another consistent measurement to a larger body of evidence.
A colony count tells researchers how many breeding birds occupy a location.
Diet information describes part of the food relationship supporting those birds.
Foraging data describe where and how they search.
Sea-ice observations describe the physical environment.
Prey surveys describe resources present in surrounding waters.
Long-term integration of those datasets can improve scientific understanding of Antarctic food-web behavior.
One way to quantify the informational gain is to compare the satellite-enabled database with a single colony-season field baseline.
A one-colony, one-year observation equals one colony-year.
The 2026 dataset contains 1,334 colony-years.
That is a 1,334-fold increase in colony-year coverage relative to the one-site, one-season baseline.
The interpretation must remain cautious. One satellite-derived colony-year is not scientifically identical to one intensive field-research year.
Field researchers can obtain much richer measurements.
The ratio measures geographic-temporal coverage, not total scientific quality.
The value becomes more apparent when asking questions at continental scale.
Field science may answer:
“What prey did these penguins consume during this breeding season at this colony?”
Satellite-enabled analysis can address:
“How did broad dietary composition vary among more than 100 colonies over decades, and how were those patterns associated with environmental conditions?”
The scientific question changes because the measurement system changes.
That is a form of capability value.
Computing and interpretation costs of several hundred dollars per image are small relative to the expansion in feasible research scope.
The cost of attempting equivalent field coverage would grow roughly with locations and years.
The cost of satellite processing grows much more slowly because automation, shared scenes, and reusable code create economies of scale.
The resulting information also has reuse value.
A dietary dataset developed for one ecological paper can support later studies of population change, sea-ice relationships, regional differences, predator-prey dynamics, conservation planning, or methodology.
Data-sharing policies extend that value beyond the originating research team.
Scientific value is consequently better understood as cumulative rather than single-use.
What Does This Example Reveal About Earth Observation Economics?
Penguin guano provides a compact example of a larger Earth-observation business and policy principle: the economic value of orbital data frequently appears downstream from the satellite itself.
The New Space Economy satellite analytics overview describes how remote-sensing data moves through processing, analytics, cloud infrastructure, and interpretation before becoming information that people can use.
The penguin case follows the same chain:
Satellite sensor → calibrated imagery → surface reflectance → colony pixels → spectral features → statistical model → dietary estimate → scientific interpretation
Each stage changes the nature of the product.
At acquisition, the user has data.
After processing, the user has measurements.
After analysis, the user has an estimate.
After scientific interpretation, the user has information that can support a biological argument.
The distinction matters for any attempt to value Earth observation.
Charging $0 for Landsat imagery does not mean Landsat creates zero economic value.
It means the U.S. government has chosen to distribute the data as public infrastructure rather than recover program value through per-image pricing.
USGS estimated Landsat’s direct economic value at about $25.6 billion for 2023 even though imagery remained available without a user charge.
Open access can increase value precisely because more people can develop downstream applications.
The processing costs quantified in this article reinforce that point.
A free scene might require approximately $500 to $600 of skilled work to become a research-grade penguin dietary observation.
The output can still replace approximately $20,000 of field effort under the central scenario.
The value does not disappear because analysts must spend money.
The relevant comparison is:
What does the complete satellite solution cost?
against:
What does the next-best practical solution cost?
For the central penguin case:
Satellite imagery: $0
Interpretation, processing, computing, and QA: approximately $1,600 for three colony-season observations
Amortized method development: approximately $375 per colony-year in the illustrative model
Fully allocated satellite pathway: approximately $1,975
Modeled field alternative: approximately $20,000
Net replacement value: approximately $18,025
Modeled cost reduction: approximately 90%
That is a more defensible valuation than calling the image “free” or assigning the entire field-expedition cost to the raw image.
The value exists in a chain.
Government investment operates the satellite and archive.
USGS processing creates consistent analysis-ready products.
Researchers supply application-specific algorithms.
Computing executes those algorithms.
Scientists interpret the result.
Field observations validate the relationship.
The final biological information depends on all of them.
Commercial Earth observation follows related economics. Customers often do not want a raw satellite image. They may want a flood boundary, crop condition estimate, wildfire map, infrastructure-risk score, vessel detection, land-use change result, or environmental compliance measurement.
New Space Economy’s discussion of current satellite applications describes this shift from orbital measurements toward decision-ready outputs.
The penguin case is a scientific version of the same commercial structure.
The spacecraft collects photons.
The downstream chain creates meaning.
That distinction has consequences for measuring the space economy.
Satellite manufacturing and launch revenue capture only part of the economic contribution.
Ground systems, data distribution, cloud services, geospatial software, analytical labor, application development, domain expertise, and user decisions can generate additional value after the spacecraft has completed the observation.
Open-data missions make this easier to see because image price and image value diverge so sharply.
A commercial image priced at $2,000 may be worth $20,000 to a user.
A government image priced at $0 may also be worth $20,000.
Price measures the transaction.
Value measures the benefit.
Cost measures the resources required to produce the result.
Those are different economic quantities.
The penguin example permits all three to be shown.
The price of Landsat access is zero.
The processing cost is approximately hundreds of dollars per scene.
The fully allocated scientific cost can approach a few thousand dollars per colony-season after development costs are included.
The replacement value may reach tens of thousands of dollars for a colony-season.
The historical scientific value can exceed any plausible replacement estimate because historical observations cannot be purchased after the fact.
This framework can be generalized to other Earth-observation applications.
Consider wildfire mapping. The cost of an image is less informative than the cost of producing a verified fire perimeter and the losses that better information may help avoid.
Consider agriculture. The image cost matters less than the cost of producing a field-level crop estimate and the economic decision that follows.
Consider flood response. The relevant product may be a map showing affected buildings, roads, and infrastructure rather than the satellite file itself.
Consider Antarctic science. The useful output may be a dietary time series derived from decades of colored penguin guano.
Processing is not a deduction from satellite value in the sense of making satellite imagery less useful.
Processing is part of the investment required to unlock that value.
The central economic ratio remains favorable because digital processing scales much more efficiently than physical access.
A scientist cannot automate a research vessel into visiting 119 Antarctic colonies for nearly 30 years at negligible marginal cost.
A scientist can automate much of an archive-processing pipeline.
That difference explains why a mature remote-sensing method can generate such a large return relative to its recurring analytical cost.
Summary
A satellite observation of penguin guano can provide information about broad Adélie penguin dietary composition because krill-rich and fish-rich diets produce measurable differences in guano spectral properties. The 2026 Current Biology study calibrated those differences using field sampling, spectroscopy, stable nitrogen isotopes, and statistical modeling, then applied the method across Landsat observations spanning 1984 through 2013.
The Landsat image itself carries a $0 access price for the researcher.
A complete economic calculation cannot stop there.
Turning a suitable image into a research-grade dietary estimate requires scene selection, quality screening, geospatial preprocessing, spectral extraction, computing, statistical analysis, scientific interpretation, documentation, and quality assurance.
For a mature workflow, a reasonable modeled recurring cost is approximately $176 to $1,400 per suitable scene, with about $500 to $600 representing a useful central estimate.
Computing itself represents a relatively small portion of that amount. A broad allowance of $1 to $50 per scene can cover ordinary computing and storage associated with this type of analysis. Specialist labor dominates the downstream cost.
Bespoke analysis involving extensive manual intervention can raise the image-level cost to approximately $1,500 to $2,500 or more.
Method development is a separate cost. Designing and validating the complete technique could plausibly represent $250,000 to more than $1 million when specialist labor, field calibration, laboratory work, software development, statistical analysis, computing, documentation, and institutional support are included. No published budget from the 2026 study supports treating that modeled range as its actual expenditure.
An illustrative $500,000 development cost spread across 1,334 colony-years adds approximately $375 per colony-year.
The study contained 3,938 colony-day observations across 1,334 colony-years, averaging about three observed colony-days per colony-year. At approximately $535 of central processing cost per observation, a conservative image-analysis allowance is roughly $1,600 per colony-season.
Add the illustrative method-development allocation and the fully loaded satellite-derived information cost becomes approximately $1,975 per colony-year.
Against an illustrative $20,000 field-replacement cost, that produces approximately:
$18,025 in net replacement value
and
about a 90% reduction in the modeled cost of obtaining broad colony-level dietary information.
The range remains wide because Antarctic field logistics differ sharply by location.
At an opportunistic field cost of $5,000, the satellite advantage is smaller.
At a remote-access cost of $80,000, the difference becomes enormous.
Across the complete 1,334 colony-years, gross field-replacement value ranges from approximately $6.67 million to $106.72 million under the modeled scenarios.
Using the central $20,000 assumption gives approximately $26.68 million.
A conservative allowance of roughly $2.11 million for image processing across 3,938 colony-day observations plus an illustrative $500,000 method-development allocation reduces the central net replacement estimate to approximately:
$24.07 million.
That figure provides a more complete assessment than the earlier $26.68 million estimate because it recognizes that free satellite data still requires paid scientific labor and computing before it becomes usable information.
The calculation remains incomplete in one respect that favors the satellite archive.
Historical observations cannot be replaced.
Scientists cannot return to an Antarctic colony in 2026 and measure its dietary conditions as they existed in 1987.
An archived satellite observation preserves information from a past state of the planet. Improved analytical methods can extract that information decades later.
The penguin example consequently produces three different monetary figures that should remain separate:
Image access price: $0
Scientific processing cost: roughly $500 to $600 per suitable scene under the central mature-workflow estimate
Application-specific replacement value: potentially thousands to tens of thousands of dollars per colony-season
A fourth category has no satisfactory dollar figure:
the scientific value of historical observations that can no longer be recreated.
That is the larger lesson behind the satellite image value calculation. The useful product is not the pixel alone. The value arises from the combination of orbital infrastructure, open archives, calibrated data, computing, analytical methods, field validation, specialist interpretation, and the scientific questions those elements allow researchers to answer.