- Key Takeaways
- The Exposure Has Already Moved Into Orbit
- How Solar Storms Reach Ground Systems and Spacecraft
- Why the May 2024 and January 2026 Events Changed the Evidence
- What the SSEEM Model Says and What It Cannot Prove
- Solar Storms and the Space Economy Are Becoming More Tightly Coupled
- Power Grids and GNSS Still Dominate Near-Term Loss
- Forecasting, Regulation, and Insurance Are Catching Up
- What Would Change the Economic Estimate
- Summary
Key Takeaways
- Mission Space estimates $20.65 billion in annualized expected loss across nine channels in 2026.
- Its model projects orbital and beyond-Earth exposure rising from 17% of loss in 2026 to 42% by 2035.
- Extreme-storm frequency and limited operator loss disclosure remain the largest sources of uncertainty.
The Exposure Has Already Moved Into Orbit
As of August 27, 2026, a CelesTrak-based live count lists 16,418 active satellites in Earth orbit, up from 16,393 on August 24, the information cut-off used by Mission Space. The difference of 25 satellites in three days illustrates how quickly the exposure base can change. Mission Space US Corp.’s August 2026 study, Solar Storms and the Space Economy, compares that orbital population with 1,980 active satellites in 2018. The expansion changes how solar storms and the space economy should be assessed. The solar hazard is old, but the amount of equipment, revenue, communications capacity, navigation dependence, computing hardware, and human activity exposed to it is much larger than it was during the previous generation of space-weather planning.
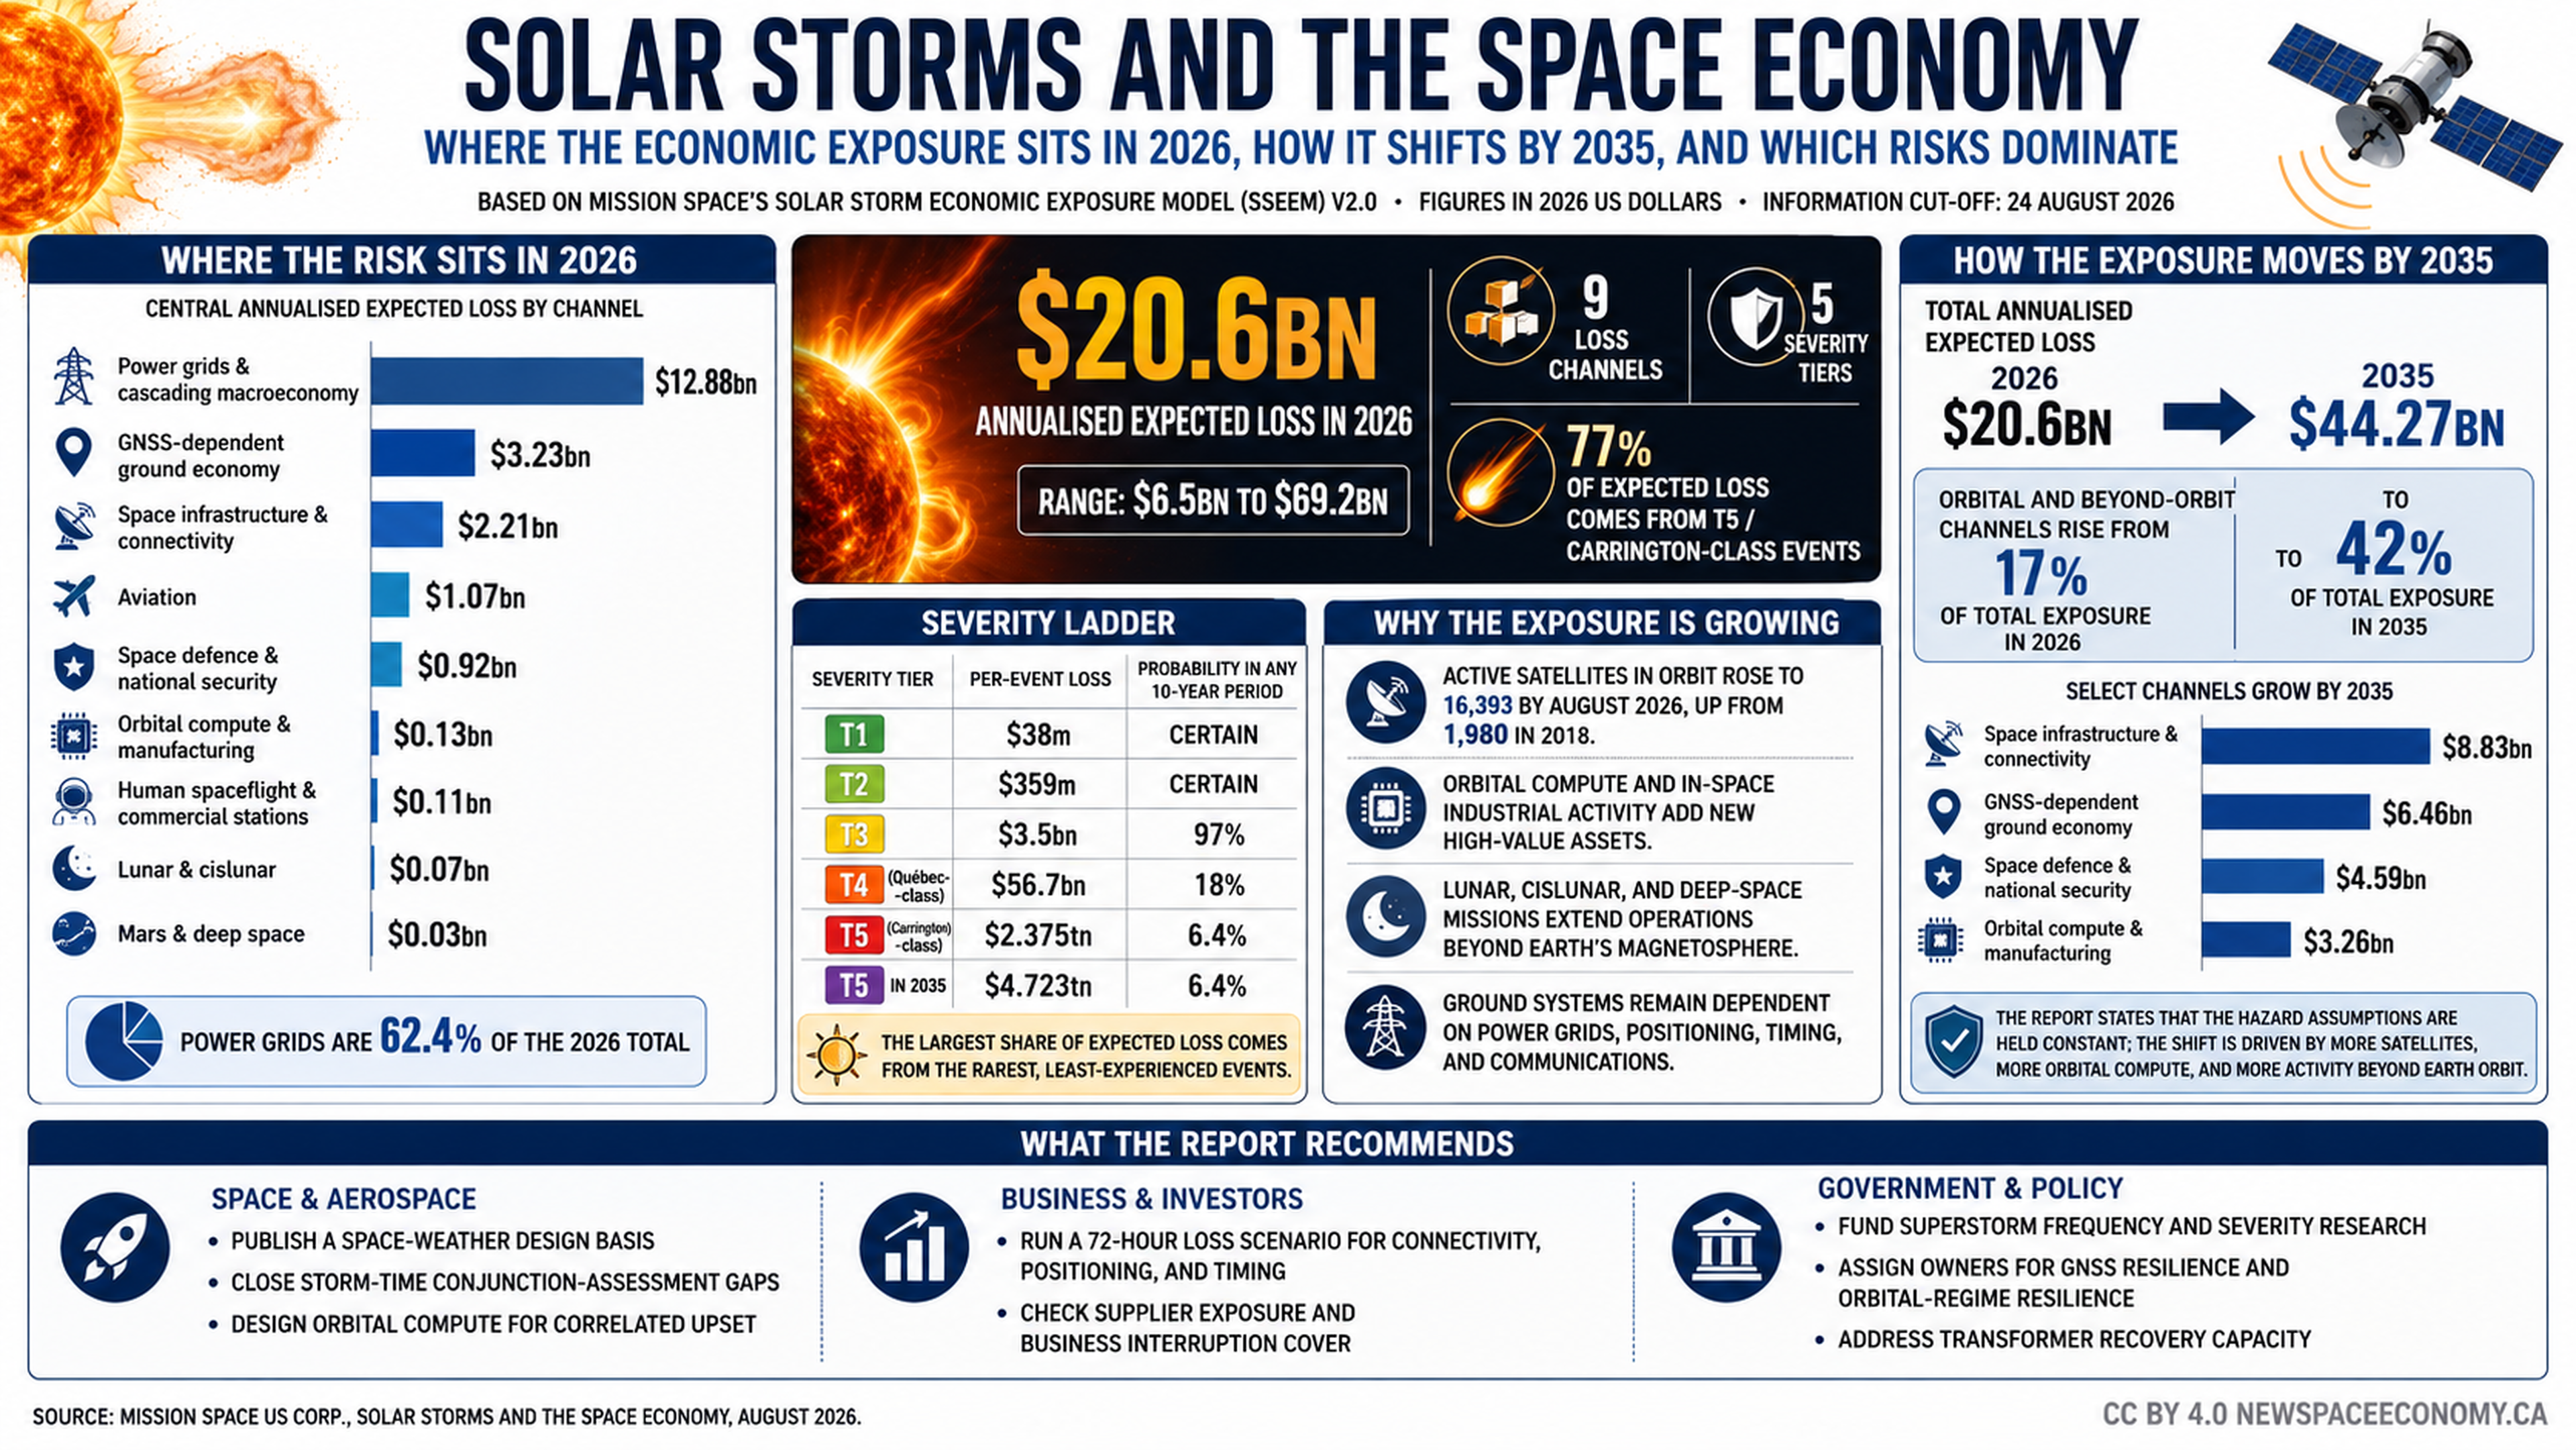
The report’s Solar Storm Economic Exposure Model, or SSEEM v2.0, estimates central annualized expected loss of $20.65 billion in 2026 across nine channels. Its low and high values, $6.45 billion and $69.23 billion, are scenario bounds produced by changing severity assumptions in the model, rather than statistical confidence intervals. Power grids account for the largest 2026 central loss at $12.88 billion, followed by the Global Navigation Satellite System, or GNSS, dependent ground economy at $3.23 billion and space infrastructure and connectivity at $2.21 billion. Mission Space projects total annualized expected loss of $44.27 billion by 2035 under its selected growth assumptions.
The commercial satellite sector is already much larger than it was during the Halloween storms of 2003. The Satellite Industry Association reported that 296 commercially procured launches deployed 4,434 satellites during 2025 and counted 14,266 operational satellites at year-end. It put the 2025 global space economy at $429 billion and commercial satellite industry revenue at $303 billion. Satellite ground equipment generated $165.2 billion, satellite services $105.0 billion, satellite manufacturing $20.4 billion, and commercial launch services $12.4 billion.
Those figures explain why spacecraft replacement cost captures only part of the exposure. Economic value associated with satellites also sits in communications subscriptions, navigation-dependent services, timing, logistics, agriculture, financial networks, data processing, government operations, and ground terminals. New Space Economy’s GNSS Market Analysis 2026 examines this downstream dependence in detail. Economic losses can occur far from the spacecraft when the signal or service becomes unreliable, even when the satellites themselves remain operational.
How Solar Storms Reach Ground Systems and Spacecraft
Space weather consists of several physical hazards that travel at different speeds and affect technology through different mechanisms. Solar flares produce electromagnetic radiation that reaches Earth at light speed, roughly eight minutes after leaving the Sun. Those emissions can interfere with high-frequency radio communications and affect navigation reception on the sunlit side of Earth. Solar energetic particles can arrive within tens of minutes to hours and increase radiation exposure for spacecraft electronics, astronauts, and high-altitude aviation. Coronal mass ejections can take roughly half a day to several days to reach Earth, where their interaction with the magnetosphere can drive geomagnetic storms.
The NOAA Space Weather Scales separate geomagnetic storms, solar radiation storms, and radio blackouts because each affects technology differently. The familiar G-scale measures geomagnetic disturbance from G1 through G5. The S-scale measures high-energy proton events from S1 through S5. The R-scale describes radio blackouts associated with solar X-ray emissions. A severe event in one category does not automatically imply equivalent severity in the others.
On the ground, rapid magnetic-field changes can generate electric fields in conductive geology. Those fields drive geomagnetically induced currents through long conductors such as transmission lines. Transformer cores can move toward saturation, reactive-power demand can rise, heating can occur, and protective systems can operate unexpectedly. North American transmission planning addresses this mechanism through NERC TPL-007-4, which establishes planning requirements for geomagnetic disturbance events and transformer thermal assessments.
The orbital mechanism is different. A geomagnetic storm deposits energy into the thermosphere, causing the upper atmosphere to heat and expand. Increased density at satellite altitude produces more drag. Satellites descend faster, predicted positions become less accurate, station-keeping requirements increase, and operators may command large numbers of maneuvers during the same period. The May 2024 Gannon storm analysis published by New Space Economy describes how those effects complicated satellite operations and conjunction assessment.
Particle radiation creates another exposure channel. High-energy particles can produce single-event upsets, change memory states, trigger latch-up, damage components, and gradually degrade solar arrays. Charging can occur on spacecraft surfaces and within insulating materials. These mechanisms may generate equipment anomalies even when atmospheric drag is unimportant.
That distinction explains why Mission Space gives significant attention to the S-scale. An operator concerned about satellite electronics, orbital computing hardware, or crew radiation cannot infer radiation conditions solely from the G-scale. The January 19, 2026 solar radiation storm reached S4, a severe level NOAA said had not been observed since October 2003. The associated geomagnetic disturbance reached G4 on January 19, demonstrating that geomagnetic and particle-radiation severity can diverge materially during the same solar event.
Why the May 2024 and January 2026 Events Changed the Evidence
The May 2024 Gannon storm supplied an operational test for an orbital population far denser than anything present during 2003. NASA’s Community Coordinated Modeling Center records a peak Kp of 9 and a Dst value of minus 412 nanoteslas. Multiple coronal mass ejections reached Earth during the event, producing the strongest geomagnetic conditions recorded in more than two decades.
Research by William Parker and Richard Linares on satellite drag during the Gannon storm found large thermospheric-density changes and significant deficiencies in short-term geomagnetic forecasts. Their work used orbital data across the low Earth orbit population to examine how increased drag affected satellite trajectories. A later peer-reviewed study of satellite drag modeling described the operational consequences as thousands of spacecraft undertaking unplanned or uncoordinated orbit-raising maneuvers during storm conditions, when trajectory prediction was already becoming less dependable.
The May 2024 storm also demonstrated that economic loss can occur without destroyed spacecraft. A 2025 Journal of Geophysical Research: Space Physics study of GPS positioning errors during the storm found errors reaching as much as 70 meters in the central United States during the storm’s main phase. Precision positioning became unstable in areas where agriculture depends heavily on GNSS-guided equipment.
Kansas State University subsequently described an assumed $565 million loss for Midwestern crop producers associated with the disruption. The economic figure should be treated as an agricultural estimate rather than as a direct measurement produced by the GPS study itself. The technical study establishes the scale of positioning degradation; agricultural economists estimate the resulting financial effect. Keeping those two pieces of evidence separate produces a more defensible account of the event.
New Space Economy’s analysis of solar activity and Starlink reentries provides another example of the relationship between space weather and satellite altitude. Increased thermospheric density raises drag most strongly for spacecraft operating at lower altitudes, making solar-cycle conditions relevant to orbital lifetime and disposal planning.
January 2026 tested a different part of the risk structure. NOAA measured an S4 severe solar-radiation storm alongside G4 geomagnetic conditions. By that point, the orbital population exceeded 16,000 active satellites and commercial computing hardware had begun operating in low Earth orbit. Mission Space treats the event as evidence that radiation and geomagnetic severity should not be collapsed into a single index.
There is still little public accounting of what the January 2026 event cost satellite operators. Spacecraft can absorb resets, temporary service degradation, additional propellant use, shortened component life, or protective shutdowns without producing a visible satellite loss. Those effects may remain inside operating accounts and never enter public databases. New Space Economy’s coverage of commercial space-weather data and enterprise risk products examines the business case for converting environmental measurements into operational decision tools even when historical loss data remain limited.
What the SSEEM Model Says and What It Cannot Prove
SSEEM v2.0 uses a frequency-severity catastrophe-modeling framework organized around five storm tiers and nine economic loss channels. Six channels cover orbital and beyond-Earth activity: space infrastructure and connectivity; orbital compute and manufacturing; human spaceflight and commercial stations; space defense and national security; lunar and cislunar activity; and Mars and deep space. Three cover terrestrial exposure: power grids and cascading macroeconomic effects, the GNSS-dependent ground economy, and aviation.
Crossing five severity tiers with nine channels creates 45 cells. Each cell contains a low, central, and high per-event loss assumption plus a confidence grade. Mission Space classifies only one of those cells as a high-confidence direct published figure. Thirteen use published figures adjusted to another geographic footprint, exposure base, or year. Thirty-one rely on structured judgment calibrated against related evidence.
That distribution matters when interpreting the headline numbers. The terrestrial side of the model has a longer history of measured outages, transformer damage, navigation disruptions, aviation interruptions, and macroeconomic studies. Orbital computing, large commercial stations, sustained lunar operations, and much of the cislunar economy have little or no historical loss record because the underlying activity is new or remains under development.
The model’s most striking finding concerns composition. Orbital and beyond-Earth channels account for 17% of modeled annualized expected loss in 2026 and 42% by 2035. Space infrastructure and connectivity rises from $2.21 billion to $8.83 billion. Orbital compute and manufacturing rises from $0.13 billion to $3.26 billion. Lunar and cislunar activity rises from about $0.07 billion to $0.79 billion. Power grids remain the largest individual channel, increasing from $12.88 billion to $18.03 billion.
Those 2035 values depend on explicit growth assumptions rather than a forecast of stronger solar activity. SSEEM applies a 25-times exposure multiple to orbital compute and manufacturing, 12 times to lunar and cislunar activity, eight times to Mars and deep space, six times to human spaceflight and stations, five times to space defense and national security, and four times to space infrastructure and connectivity.
The 25-times orbital-compute assumption deserves particular caution. New Space Economy’s assessment of orbital data centers separates operational demonstrations from far larger proposals for data-center-scale infrastructure in orbit. Computing hardware has flown and commercial experimentation is real, but large orbital computing systems still face questions involving launch economics, thermal management, radiation tolerance, servicing, communications, congestion, and customer demand.
SSEEM also excludes some pathways that could change aggregate losses. It does not price a debris cascade triggered by degraded conjunction assessment, fatalities or injuries, deliberate exploitation of degraded sensing conditions, detailed infrastructure interdependencies, or events larger than its Carrington-class ceiling. It does not explicitly model how loss compounds with outage duration. Channel losses are added within a storm tier rather than calculated through a detailed dependency network.
Those limitations do not invalidate the model. They define what the numbers mean. SSEEM is more useful as an explicit framework for examining exposure, sensitivity, and missing data than as a prediction that a particular dollar loss will occur in a particular year.
Solar Storms and the Space Economy Are Becoming More Tightly Coupled
The exposure shift is visible in operator decisions before it appears in insurance claims. Starlink is now lowering satellites to below 500 kilometers as part of a constellation reconfiguration scheduled through the end of 2026. The company says the lower altitude can reduce ballistic decay time by more than 80% during solar minimum, turning a potential four-plus-year natural decay period into a period of months for a failed spacecraft.
That decision demonstrates the connection between solar-cycle physics and constellation architecture. During more active solar conditions, greater thermospheric density produces more drag. As the Sun moves toward solar minimum, the thermosphere becomes thinner and failed spacecraft can remain aloft longer. Operating at lower altitude increases drag sufficiently to accelerate natural removal if propulsion becomes unavailable. It can also reduce exposure to debris and planned constellations concentrated at higher altitudes.
The same relationship works in the opposite direction during geomagnetic storms. A sudden density increase can create unexpectedly high drag for spacecraft already operating low in the atmosphere. The February 2022 Starlink deployment demonstrated the result when a geomagnetic disturbance increased drag shortly after launch and 38 satellites subsequently reentered. NASA provides a concise visualization of the 2022 Starlink satellite loss mechanism.
Human activity beyond low Earth orbit creates a different dependence. Earth’s magnetic field and atmosphere shield people and electronics from much of the particle environment experienced in deep space. Crews in cislunar space and on the lunar surface lose much of that protection. The European Space Agency’s work on protecting lunar explorers from radiation explains why solar energetic particle monitoring, shelter access, and mission planning become operational requirements beyond the magnetosphere.
New Space Economy’s examination of why the Moon is an equipment killer places radiation alongside dust, thermal cycling, vacuum, charging, and other environmental stresses. Longer-duration lunar activity changes the probability calculation. A short mission may avoid a severe particle event by chance. Infrastructure operating for years has far more opportunity to encounter one.
Economic concentration also matters. A broadband constellation can simultaneously serve households, aircraft, ships, businesses, emergency organizations, and government customers. GNSS serves agriculture, telecom synchronization, financial timing, surveying, transportation, and resource industries. The same solar disturbance can degrade several of these services at once.
This makes space weather different from an isolated satellite malfunction. A manufacturing defect might affect one spacecraft model. A launch accident might affect one payload group. A solar storm can impose correlated effects across large orbital regions and multiple terrestrial industries during the same event.
That property has direct implications for resilience planning. Backup communications, alternative positioning sources, terrestrial timing systems, manual operating procedures, radiation-tolerant computing, crew shelters, spare hardware, and coordinated maneuver protocols address different parts of the same systemic exposure.
Power Grids and GNSS Still Dominate Near-Term Loss
The growing orbital component should not obscure how much 2026 exposure remains on Earth. Mission Space assigns 62.4% of its central annualized expected loss to power grids and cascading macroeconomic effects. GNSS-dependent ground activity accounts for another 15.7%. Space infrastructure and connectivity represents 10.7%, aviation 5.2%, and space defense and national security 4.4%.
The near-term model is consequently still dominated by terrestrial systems, even though its fastest assumed growth rates are found off-planet.
Grid exposure has long recovery implications because high-voltage transformers are specialized assets that can take substantial time to replace. Geomagnetically induced current can heat transformer components, disturb voltage control, increase reactive-power demand, and cause protective equipment to operate unexpectedly. NERC’s geomagnetic disturbance standard requires covered transmission planners to assess benchmark conditions and evaluate thermal effects on transformers.
The historical reference remains the March 1989 Hydro-Québec blackout, when a geomagnetic storm contributed to the collapse of the Québec grid. Six million customers lost electricity for roughly nine hours. Equipment elsewhere in North America also experienced storm-related effects. That event remains important because it demonstrates that space weather can produce geographically distributed consequences rather than a single isolated failure.
A modern extreme event would occur in an economy with greater dependence on electricity, digital communications, cloud services, satellite navigation, automated logistics, and tightly coupled supply chains. The indirect loss can exceed the physical repair bill because businesses cannot operate normally when electricity, communications, or positioning services are unavailable.
Lloyd’s 2025 extreme space-weather scenario offers an independent benchmark for the size of the economic tail. Lloyd’s estimated a probability-weighted global economic loss of $2.4 trillion over five years for its hypothetical solar-storm scenario, with modeled losses ranging from $1.2 trillion to $9.1 trillion across severity cases. Its expected-loss figure was $17 billion under the probability assumptions used in that model.
Those numbers should not be mathematically combined with SSEEM. The models use different probability structures, scenario definitions, and time horizons. Their significance lies in convergence at a broader level: independent approaches find that extreme space weather can create losses far beyond the direct replacement cost of damaged equipment.
GNSS illustrates that distinction particularly well. A positioning disturbance does not require destruction of the navigation satellites. Ionospheric effects can corrupt signal propagation temporarily and create severe errors for applications that require high precision. Agriculture, surveying, aviation, logistics, telecom timing, and financial systems can suffer operating losses even when the space segment continues broadcasting.
Resilience measures consequently need to extend beyond spacecraft hardening. Multi-frequency receivers, multi-constellation capability, alternative timing sources, terrestrial navigation backups, manual operating modes, and rehearsed procedures can reduce economic loss when satellite-based services become unreliable.
Forecasting, Regulation, and Insurance Are Catching Up
Forecasting capability improved materially in 2026 with NOAA’s SOLAR-1 observatory. Originally launched as Space Weather Follow On-Lagrange 1, the spacecraft reached its operating location near the Sun-Earth L1 point in January 2026. NOAA placed SOLAR-1 into operational service on June 10, 2026, providing continuous observations of solar wind and the upstream space environment.
The observatory improves the quality and continuity of measurements used by NOAA’s Space Weather Prediction Center. It does not eliminate the physics that limits warning time. A solar flare’s electromagnetic emissions travel at light speed, so the radiation reaches Earth at essentially the same time that Earth-based observers detect the flare. Coronal mass ejections travel much more slowly and can often be observed before arrival, but the magnetic orientation that determines how strongly an arriving structure couples with Earth’s magnetosphere remains difficult to measure accurately far in advance.
The European Space Agency plans to approach the problem from another geometry with the Vigil mission. Vigil remains planned for launch in 2031 and is under development as of August 27, 2026. Its destination is the Sun-Earth L5 region, giving it a side view of solar structures that is unavailable from the direct Sun-Earth line.
ESA says Vigil could provide four to five days of warning for some space-weather effects and improve estimates of the speed, direction, and Earth-impact probability of coronal mass ejections. Additional warning time could support satellite configuration changes, grid operating decisions, aviation routing, crew shelter procedures, and mission planning. It will not make every solar disturbance predictable.
Regulatory maturity differs sharply between industries. North American grid operators have a mandatory geomagnetic disturbance planning standard. Satellite licensing addresses spectrum, debris mitigation, and other safety matters, but there is no equivalent universal requirement for operators to publish the space-weather environment used as a spacecraft design basis.
Mission Space proposes greater disclosure of drag assumptions, radiation tolerance, crew shielding, and solar-cycle assumptions used in disposal analysis. It also calls for storm-time protocols for sharing tracking information and coordinating maneuvers when atmospheric-density uncertainty affects many operators simultaneously.
Insurance faces an accompanying data problem. Additional propellant consumption, temporary computing interruption, navigation-service degradation, shortened component life, and protective shutdowns can create economic losses without producing a destroyed asset. Traditional insurance structures based on physical damage may not match every such pathway.
Parametric insurance offers one possible approach. Payments could be tied to externally measured environmental conditions, such as proton flux, thermospheric density, or navigation disturbance, rather than requiring proof that a specific component physically failed. Developing such products would still require better data connecting environmental measurements to actual financial losses.
Operator disclosure could improve both engineering and insurance. Standardized post-event reporting of anomaly counts, additional station-keeping expenditure, service interruption, recovery time, and component degradation would give modelers observations that are largely absent today.
What Would Change the Economic Estimate
The largest uncertainty in SSEEM concerns the recurrence rate assigned to Carrington-class storms. Published research does not produce a single accepted probability. A 2012 study by Pete Riley on the probability of extreme space-weather events estimated a much higher decadal probability than later statistical work.
A 2019 Scientific Reports study by Pere Puig, Marta Moriña, and colleagues on Carrington-like storm probability produced a substantially lower estimate. Mission Space identifies published values spanning roughly 0.46% to 12% per decade and uses a 1-in-150-year assumption in its central model. Changing the recurrence assumption without changing severity moves SSEEM’s annualized expected loss across a broad range.
Severity has also come under renewed scientific examination. A Nature study published July 15, 2026 by Nithin Sivadas and colleagues investigated the apparent saturation of Earth’s geomagnetic response under intense solar-wind driving. The authors concluded that measurement uncertainty and regression to the mean can explain the observed saturation effect and found that a linear response remained consistent with the corrected data across the measured range.
The paper’s implications concern the extreme tail. If the magnetospheric response does not saturate in the way some earlier models assumed, very strong solar-wind conditions could produce larger geomagnetic effects than those models would predict. Mission Space treats a doubling of upper-tier severity as a sensitivity case rather than as its baseline assumption. Under that case, its modeled Carrington-class loss rises from about $2.4 trillion to $4.8 trillion and annualized expected loss rises from $20.6 billion to $37.8 billion.
Independent replication matters because a single new study should not automatically reset national planning standards, insurance models, or capital requirements. Confirmation through other data sets and methods would provide a stronger basis for changing extreme-event assumptions.
Evidence can also push estimates downward. Better radiation-tolerant computing could reduce orbital-compute vulnerability. Multi-frequency and multi-constellation receivers can reduce some GNSS errors. Grid hardening and improved operating procedures can reduce transformer and outage losses. Better forecasting can turn some disruption into manageable operating cost. Slower deployment of orbital computing or lunar infrastructure would reduce 2035 exposure without any change in solar activity.
One of the largest opportunities lies in measurement rather than forecasting. Public catalogs can count satellites and track their orbits, but they do not reveal storm-attributable fuel consumption, temporary service loss, radiation upset rates, additional staff workload, component resets, shortened hardware life, or revenue effects.
That information exists inside operating organizations. A shared post-event disclosure framework could convert part of SSEEM’s structured judgment into empirical evidence without requiring companies to reveal sensitive engineering designs. Operators could publish standardized ranges for anomalies, additional maneuvering, service interruption, recovery duration, and environmental measurements. Insurers, regulators, researchers, investors, and operators could then compare resilience decisions against real sector experience.
Summary
As of August 27, 2026, the CelesTrak-based active satellite count has reached 16,418, compared with 1,980 in 2018. That growth captures the central reason space weather now has a different economic profile. Society has placed more hardware in orbit and has connected more terrestrial activity to services originating in space.
Mission Space’s SSEEM v2.0 puts central annualized expected loss at $20.65 billion in 2026 and projects $44.27 billion by 2035 under its stated growth assumptions. Orbital and beyond-Earth channels rise from 17% to 42% of the modeled total. Those numbers are model outputs rather than observed losses, and the report openly identifies the assumptions that make the off-planet figures less certain than the terrestrial estimates.
Independent evidence supports the direction of the exposure argument more strongly than any exact price tag. The 2026 State of the Satellite Industry Report documents the rapid expansion of orbital infrastructure. The Gannon storm research demonstrates how severe geomagnetic conditions can disrupt satellite trajectory prediction. The GPS study documents positioning errors reaching 70 meters during the same event. NOAA’s January 2026 measurements show that severe particle-radiation conditions can occur without an equally severe geomagnetic classification.
Forecasting infrastructure is responding. SOLAR-1 became operational in June 2026, and ESA’s Vigil remains planned for 2031. Starlink is lowering satellite shells partly to improve disposal performance as solar minimum approaches. Grid standards already incorporate geomagnetic disturbance planning, and insurers are examining correlated space-weather losses.
The economic issue is no longer confined to whether a solar storm can damage a transformer or disable a satellite. It includes simultaneous disruption across electricity, positioning, communications, aviation, orbital operations, computing, and human activity beyond Earth. The most defensible reading of the evidence available on August 27, 2026 is that economic exposure is expanding faster than the historical loss record needed to price it accurately. Better measurements, operator disclosure, forecasting, engineering standards, contingency procedures, and extreme-event science can narrow that gap before more capital depends on infrastructure operating in the path of the next severe solar storm.