- Key Takeaways
- The New Space Economy Audience on August 14, 2026
- LinkedIn Reaches an Experienced Professional Audience
- Website Traffic Favors Direct and Desktop Consumption
- Newsletter Growth Converts Discovery Into Repeat Attention
- Geography Shows a United States Anchor With Broad International Reach
- Device Behavior Separates Social Discovery From Website Consumption
- The Audience Profile Fits New Space Economy’s Editorial Model
- What the Audience Data Reveals
- Summary
Key Takeaways
- LinkedIn visitors skew senior, with 77.0% in leadership-related seniority categories.
- Website use is heavily direct and desktop, pointing to deliberate information consumption.
- Newsletter growth and engagement demonstrate recurring international attention beyond social discovery.
The New Space Economy Audience on August 14, 2026
On August 14, 2026, 77.0% of visitors represented in the New Space Economy LinkedIn seniority profile fell into senior, chief-level executive (CXO), director, vice president, owner, or manager categories. That figure provides a useful opening view of the New Space Economy audience: the publication reaches a substantial concentration of people whose LinkedIn profiles indicate experience, organizational responsibility, or decision-making authority. The audience picture becomes more informative when LinkedIn data is considered beside website traffic and weekly newsletter performance rather than treated as a stand-alone social-media measure.
The three channels provide complementary views of the audience. LinkedIn describes Page visitors through professional attributes such as seniority, industry, company size, and location. Website analytics describe traffic sources, devices, and countries associated with visits to New Space Economy. Newsletter analytics describe subscribers, geographic distribution, acquisition growth, opens, clicks, and reactivity. Together, they provide a broader picture of discovery, direct consumption, and recurring engagement.
That distinction matters because New Space Economy describes itself as an independent digital publication and market-intelligence resource serving professionals, analysts, investors, and informed enthusiasts. Its coverage includes commercial markets, government procurement, satellite services, space infrastructure, defense applications, historical material, science, economics, and policy. The professional mix visible in the audience profile aligns closely with that editorial positioning.
The breadth of the readership also fits the breadth of the sector itself. The OECD Handbook on Measuring the Space Economy describes a space economy involving government and commercial actors, technologies, services, users, and economic activity extending beyond spacecraft production. New Space Economy’s own space economy guide similarly connects spacecraft and launch with ground systems, software, data, finance, regulation, professional services, workforce development, and customer applications.
The August 2026 audience profile shows how separate publishing channels support different forms of attention. LinkedIn has a stronger mobile component than the website. The website has a very high direct-traffic share and a pronounced desktop preference. The newsletter captures recurring engagement through subscriptions, opens, and clicks rather than page visits alone.
The comparison below summarizes the strongest characteristics of each channel.
| Channel | Primary Measure | Leading Geographic Signal | Behavioral Signal |
|---|---|---|---|
| LinkedIn Page | Visitor Professional Demographics | Washington, D.C.-Baltimore Area, 6.7% | 77.0% Leadership-Related Seniority; 60.8% Desktop |
| Website | Traffic, Country, and Device | United States, 33.3% | 76.3% Direct; 84.4% Desktop |
| Weekly Newsletter | Subscribers, Growth, and Engagement | United States, 33.3% | 46.6% Acquisition Growth; 37.6% Opens |
The combined picture shows a recognizable pattern: professional seniority on LinkedIn, strong desktop consumption on the website, and measurable repeat engagement through email. Those characteristics fit a publication whose subject matter often requires time, concentration, and professional context.
LinkedIn Reaches an Experienced Professional Audience
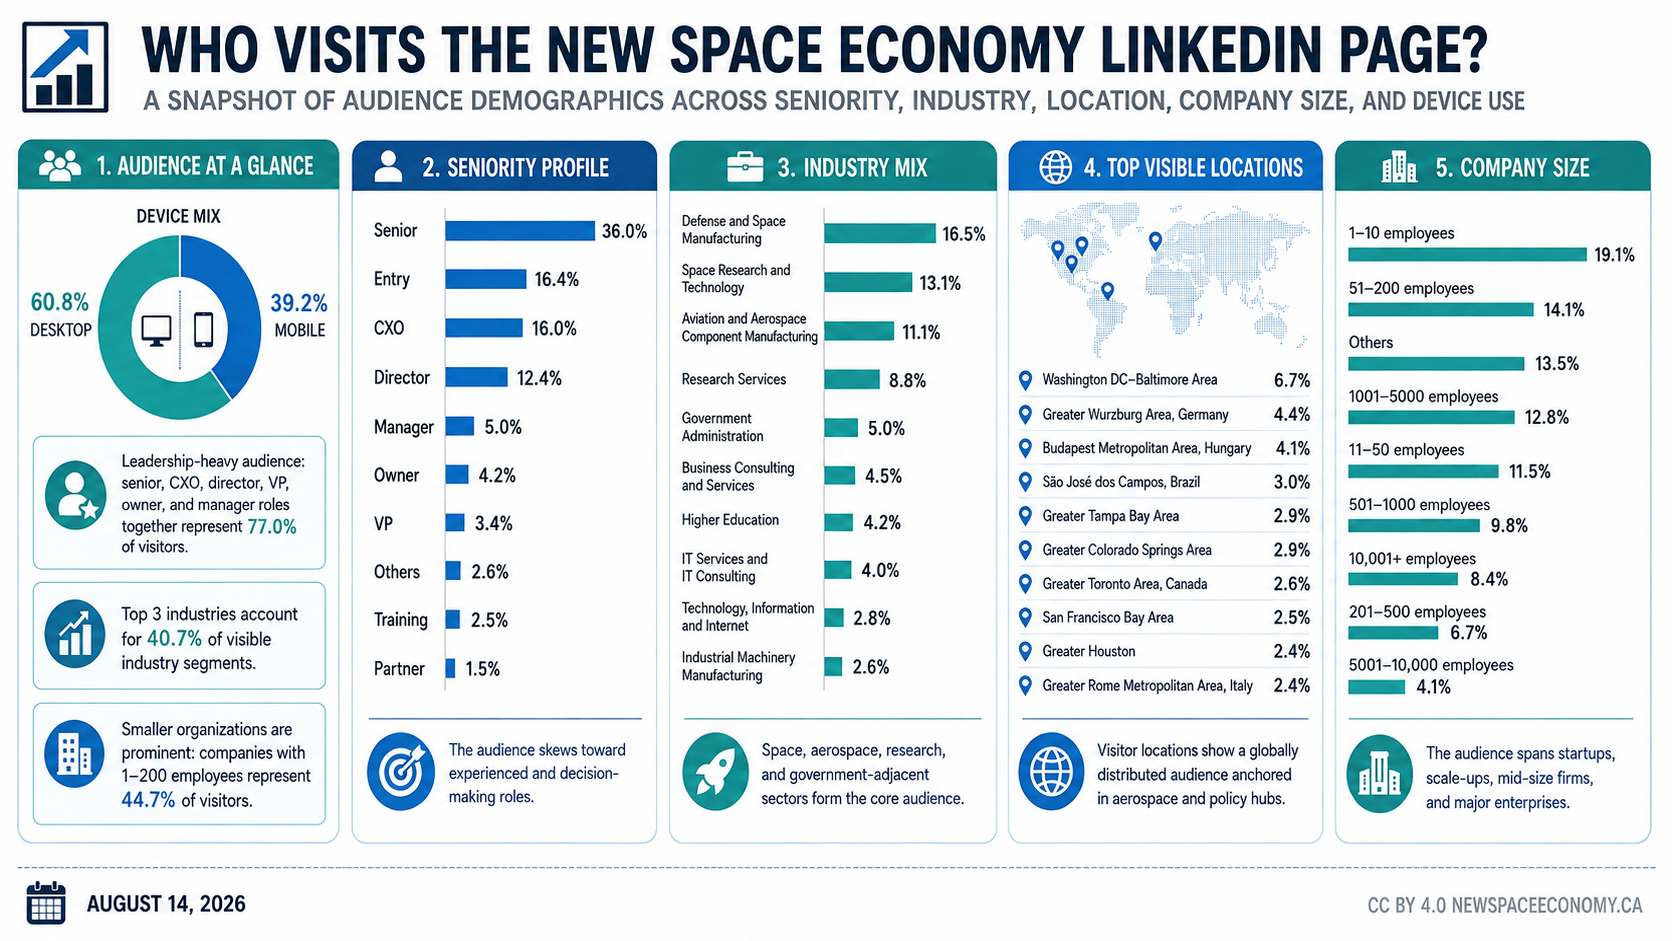
The LinkedIn profile provides the richest professional view of the New Space Economy audience. Senior-level visitors account for 36.0% of the visible seniority mix, followed by entry at 16.4%, CXO at 16.0%, director at 12.4%, manager at 5.0%, owner at 4.2%, vice president at 3.4%, others at 2.6%, training at 2.5%, and partner at 1.5%. When senior, CXO, director, vice president, owner, and manager categories are grouped, they total 77.0%. The Page audience therefore has a pronounced concentration of experienced and leadership-level professionals, with entry-level visitors still representing a substantial 16.4%.
LinkedIn’s official Page visitor analytics documentation explains that visitor demographics can be examined by job function, location, seniority, industry, and company size. These measures are particularly useful for a professional publication because they show the kinds of organizations, roles, and sectors represented among Page visitors.
Industry data reinforces the professional orientation. Defense and space manufacturing represents 16.5% of visible industry segments. Space research and technology contributes 13.1%, and aviation and aerospace component manufacturing contributes 11.1%. Together, those three sectors account for 40.7%. Research services adds 8.8%, government administration 5.0%, business consulting and services 4.5%, higher education 4.2%, IT services and IT consulting 4.0%, technology, information and internet 2.8%, and industrial machinery manufacturing 2.6%.
The mix extends well beyond companies that build spacecraft or launch vehicles. Research organizations, public administration, consulting, information technology, higher education, and industrial manufacturing all appear in the visible audience. The OECD’s measurement framework similarly treats the space economy as an economic system involving public and private organizations, enabling technologies, services, research, and end users rather than a narrow manufacturing category.
Company size adds another layer. Companies with one to 10 employees represent 19.1%, the largest single company-size category. Firms with 51 to 200 employees account for 14.1%, and companies with 11 to 50 employees add 11.5%. Those three smaller-company groups total 44.7%. The prominence of smaller organizations indicates strong reach into startups, specialized suppliers, consultancies, and smaller technology companies.
Large organizations are well represented as well. Companies with 1,001 to 5,000 employees account for 12.8%, those with 501 to 1,000 employees account for 9.8%, organizations with more than 10,000 employees contribute 8.4%, companies with 201 to 500 employees account for 6.7%, and organizations with 5,001 to 10,000 employees represent 4.1%. The 13.5% “Others” category adds another segment outside the listed company-size categories.
This combination is particularly relevant to the space economy. Commercial space activity includes small venture-backed companies, established suppliers, large aerospace manufacturers, research institutions, government agencies, multinational technology companies, and professional-services firms. New Space Economy’s audience spans much of that organizational range.
Visible locations are similarly distributed. Washington, D.C.-Baltimore leads at 6.7%, followed by Greater Würzburg in Germany at 4.4%, Budapest at 4.1%, São José dos Campos in Brazil at 3.0%, Greater Tampa Bay and Greater Colorado Springs at 2.9% each, Greater Toronto at 2.6%, San Francisco Bay Area at 2.5%, and Greater Houston and Greater Rome at 2.4% each.
Several of these metropolitan areas have strong connections to aerospace, government, research, technology, defense, manufacturing, or space operations. Washington is a center of U.S. federal policy and procurement. Colorado Springs has a large space and defense presence. Houston is closely connected to human spaceflight and aerospace. São José dos Campos is one of Brazil’s principal aerospace centers. The international mix reinforces the publication’s global reach.
LinkedIn device use provides another important characteristic. Desktop represents 60.8% of visits and mobile represents 39.2%. LinkedIn therefore operates as a mixed-device discovery environment, with a substantial mobile audience alongside the larger desktop segment.
Website Traffic Favors Direct and Desktop Consumption

Website analytics show a distinctly different behavior pattern. Direct traffic accounts for 76.3% of visits. Organic search contributes 15.1%, other channels 4.3%, referral traffic less than 2%, and unassigned traffic less than 2%. Direct therefore dominates the website’s acquisition mix by a considerable margin.
Google’s official Analytics acquisition documentation identifies Direct as one of its default traffic classifications. Direct traffic can include visits from bookmarks, typed addresses, copied links, and sessions where a more specific referring source is unavailable.
A 76.3% direct share points to a website receiving a substantial amount of traffic through direct or unattributed return paths rather than depending principally on search engines. For a specialist publication, that is an important audience characteristic because it indicates that traffic is reaching the site through more than search discovery alone.
Organic search still contributes 15.1% of traffic and remains a meaningful acquisition source. Search therefore works alongside direct traffic rather than functioning as the dominant route. Other, referral, and unassigned channels account for much smaller portions of the total.
Device usage is even more distinctive. Desktop accounts for 84.4% of website use, mobile for 15.0%, tablet for less than 1%, and smart TV for less than 1%. The website is therefore overwhelmingly desktop-oriented.
That distribution differs substantially from the LinkedIn Page, where desktop accounts for 60.8% and mobile for 39.2%. The website’s desktop share is 23.6 percentage points higher than LinkedIn’s. The contrast fits a publishing pattern in which LinkedIn serves as a discovery channel across computers and mobile devices, whereas the website is more commonly consumed on larger screens.
New Space Economy publishes long articles, market explanations, technical discussions, tables, historical material, and extensive visual resources. Many of those formats benefit from a larger display, particularly when readers are comparing information, opening related sources, viewing detailed infographics, or working in a professional environment.
Geography also distinguishes the website audience. The United States represents 33.3% of website traffic, Singapore 18.6%, China 15.1%, Vietnam 4.2%, and all other locations 28.8%. Singapore and China together contribute 33.7%, slightly exceeding the United States. Adding Vietnam brings the three named East and Southeast Asian markets to 37.9%.
That 37.9% share gives the website a strong Asia-Pacific dimension. The United States remains the largest individual country, but substantial traffic from Singapore, China, and Vietnam creates a more internationally balanced profile than a predominantly U.S. publication would normally display.
The website’s traffic mix fits a publication with a large amount of material that can be reached through search, bookmarks, newsletters, shared links, or direct navigation. As of August 14, 2026, the New Space Economy infographics library organizes visual material across 50 portfolios covering subjects ranging from space exploration and satellites to market analysis, artificial intelligence, space law, human spaceflight, national space governance, and the space economy.
The combination of direct traffic, organic search, desktop use, and international geography gives the website a distinct role within the broader audience model. LinkedIn identifies professional discovery. The website shows where people consume New Space Economy material in the publication’s own environment.
Newsletter Growth Converts Discovery Into Repeat Attention

The weekly newsletter provides the clearest view of recurring audience engagement. Subscriber acquisition from January through July 2026 ran 46.6% above the same period in 2025. Expressed as an index, January-July 2025 is represented as 100% and January-July 2026 as 146.6%.
The growth figure demonstrates a substantial acceleration in new subscriber acquisition. Rather than disclosing absolute subscriber numbers, the percentage comparison shows how the acquisition pace changed between the same seven-month periods in consecutive years.
The New Space Economy weekly newsletter provides an owned distribution channel that gives subscribers a recurring connection with the publication. Unlike search or social discovery, email allows new material to reach an established audience without requiring people to rediscover the site independently.
Engagement metrics show an overall open rate of 37.6%, an overall click rate of 12.4%, and overall reactivity of 33.1%. Overall opens represent the share of delivered emails that were opened. Overall clicks represent the share of delivered emails that generated a click. Reactivity represents the share of opens that resulted in at least one click.
The relationship among the figures is straightforward. Dividing the 12.4% click rate by the 37.6% open rate produces approximately 33.0%, closely matching the reported 33.1% reactivity rate after rounding. About one-third of opened newsletters therefore generate at least one click.
That click behavior is significant because it shows movement from email exposure into linked content. Opening an email indicates attention to the newsletter itself. Clicking indicates further engagement with the material being promoted or discussed.
Geographic reach is broad. Country information is available for 96.7% of subscribers, representing 89 identified countries. The United States accounts for 33.3%, Canada 6.2%, India 6.0%, the United Kingdom 3.9%, France 3.4%, Italy 3.0%, the Netherlands 2.5%, Brazil 2.3%, Spain 2.3%, and Germany 2.0%.
The geographic mix spans North America, Europe, Asia, and South America. The United States is the largest individual market, but two-thirds of subscribers are outside the United States. Canada and India form the next-largest national groups, followed by a distributed set of European countries and Brazil.
The 10 country percentages shown add to 64.9%. The infographic’s explanatory callout gives 65.7% for the top 10 countries, indicating a difference between the rounded displayed values and the separate aggregate calculation. The individual country percentages remain the clearest basis for comparing national audience shares.
The newsletter profile adds an important dimension that neither LinkedIn nor website traffic provides. LinkedIn shows who is visiting a professional social page. Website analytics show how and where people reach the publication. Newsletter performance shows recurring connection over time.
Subscriber acquisition increasing by 46.6% between comparable January-July periods indicates that the recurring audience channel is expanding. A 37.6% open rate shows that a substantial share of delivered newsletters generates an open, and a 12.4% click rate shows that a meaningful share of delivered messages produces further interaction.
Together, those measures indicate that the newsletter functions as more than an announcement channel. It is becoming an important mechanism for audience retention and repeat traffic.
Geography Shows a United States Anchor With Broad International Reach
The United States accounts for 33.3% in both the website country profile and the newsletter subscriber profile. That repeated percentage identifies the United States as the largest named national market in both channels.
Beyond the United States, the geographic patterns differ by channel. Website traffic shows substantial representation from Singapore at 18.6% and China at 15.1%, with Vietnam adding 4.2%. Newsletter data gives Canada 6.2% and India 6.0% the next-largest named shares after the United States, followed by several European countries.
LinkedIn provides another geographic perspective by reporting metropolitan areas. Washington, D.C.-Baltimore leads the visible list at 6.7%, followed by locations in Germany, Hungary, Brazil, Canada, Italy, and several U.S. aerospace or government centers.
The result is an audience with different concentrations depending on how people interact with the publication. Website consumption has a strong East and Southeast Asian component. Newsletter subscriptions are more broadly distributed through North America, Europe, India, and Brazil. LinkedIn emphasizes metropolitan professional clusters.
Washington, D.C.-Baltimore’s 6.7% share of LinkedIn visitors fits New Space Economy’s coverage of government procurement, policy, defense, regulation, and agency programs. Greater Colorado Springs and Greater Houston add prominent U.S. aerospace and defense regions. São José dos Campos is one of Brazil’s leading aerospace centers, and Greater Toronto contributes a major Canadian business and technology hub.
The international distribution reflects the structure of the space economy itself. The OECD space economy framework describes space activity as involving governments, commercial operators, research institutions, suppliers, service companies, and users across national borders. New Space Economy’s space economy value-chain coverage similarly places upstream and downstream activities within a larger system of economic relationships.
The website’s Asia-Pacific concentration is particularly striking. Singapore, China, and Vietnam together account for 37.9% of website traffic. That is larger than the 33.3% U.S. share and demonstrates that the publication’s website audience extends deeply into East and Southeast Asia.
The newsletter shows a different form of international reach. Country information is available for 96.7% of subscribers across 89 identified countries. This breadth indicates that recurring readership is geographically dispersed rather than confined to one national market.
Taken together, the geographic profile supports New Space Economy’s global editorial focus. The audience includes major U.S. space and policy centers, European markets, Canadian readers, substantial Asian website traffic, Indian newsletter subscribers, and representation from Brazil.
Device Behavior Separates Social Discovery From Website Consumption
The strongest device contrast is between LinkedIn and the New Space Economy website. LinkedIn Page visitors are 60.8% desktop and 39.2% mobile. Website traffic is 84.4% desktop and 15.0% mobile, with tablet and smart TV each below 1%.
Desktop leads both channels, but the website’s desktop share is 23.6 percentage points higher than LinkedIn’s. That difference provides a useful indication of how the channels function within the publication’s audience model.
LinkedIn operates within a professional social network where material can be encountered in a feed on either a computer or a phone. New Space Economy’s website contains long articles, tables, analysis, graphics, resource pages, and a substantial infographics library. The pronounced desktop preference fits a website oriented toward extended reading, research, detailed visual material, and professional use.
Mobile remains an important component of LinkedIn because 39.2% of Page visitors use mobile devices. Social discovery therefore needs to work effectively on smaller screens. Titles, lead graphics, descriptions, and links have to communicate their subject quickly and clearly even when the associated long-form content is more frequently consumed from a desktop computer.
The difference also creates a natural division between discovery and consumption. LinkedIn can introduce an article or infographic in a mixed-device environment. The website then provides the full publication experience, with desktop representing more than four-fifths of use.
Mobile website usage at 15.0% remains substantial enough to matter. Responsive page design, legible typography, accessible navigation, and mobile-friendly graphics continue to support a meaningful segment of visitors even though desktop clearly dominates.
The device profile is therefore more than a technical statistic. It provides insight into the likely role of each distribution channel. LinkedIn reaches people in a mixed desktop-mobile professional environment. New Space Economy’s website serves an audience that overwhelmingly prefers desktop access for direct consumption.
The Audience Profile Fits New Space Economy’s Editorial Model
New Space Economy’s stated editorial identity centers on objective coverage of the commercial, technological, policy, scientific, economic, and strategic dimensions of space. The audience profile fits that model closely. LinkedIn shows a high concentration of experienced professional roles. Industry representation is led by defense and space manufacturing, space research and technology, and aerospace component manufacturing. Website behavior is heavily desktop and direct. Newsletter acquisition increased substantially between comparable 2025 and 2026 periods and produces measurable opens and clicks.
The fit is meaningful because the space economy extends well beyond a single industrial category. The New Space Economy guide describes a system linking spacecraft, ground infrastructure, data, finance, regulation, workers, customers, and applications. The U.S. Bureau of Economic Analysis space economy program similarly measures space-related economic activity across multiple industries rather than treating it as one isolated manufacturing sector.
The company-size profile reflects that breadth. A combined 44.7% of visible LinkedIn visitors are associated with organizations employing one to 200 people. At the same time, substantial shares come from organizations employing hundreds, thousands, or more than 10,000 people.
This gives New Space Economy exposure across startups, smaller suppliers, consultancies, research organizations, government institutions, established aerospace companies, and large enterprises. A publication serving this mix needs to explain market developments in a way that connects technical developments with commercial, policy, operational, and strategic implications.
The seniority profile adds another dimension. With 77.0% of LinkedIn visitors falling into leadership-related categories, much of the audience appears positioned to influence projects, budgets, procurement, policy, strategy, research priorities, or business decisions. The 16.4% entry-level share also indicates reach among people earlier in their careers.
That combination gives the publication a multigenerational professional audience. Experienced executives and managers can use the publication for market and policy context, whereas people entering the sector can use it to build familiarity with technologies, companies, programs, and economic relationships.
The three channels form a complementary publishing system. LinkedIn provides professional discovery. Search and direct visits bring people into the website’s archive. The newsletter creates recurring contact and directs subscribers back toward new material.
The website’s direct classification is particularly valuable for an independent publication. Search engines and social platforms remain important distribution channels, but direct visits, bookmarks, shared links, and email provide additional routes back to the publication. Organic search contributes 15.1%, giving the site a meaningful discovery channel alongside direct traffic.
Content format also corresponds with the device profile. Long analytical material can be read on phones, but the 84.4% desktop share demonstrates that website consumption is overwhelmingly computer-based. Infographics provide a complementary format by condensing complex subjects into visual structures that can be scanned, shared, downloaded, or used as entry points into deeper articles.
As of August 14, 2026, the infographics resource organizes its collection into 50 portfolios rather than presenting visual material as an undifferentiated archive. That structure supports a publication model in which written and visual material reinforce one another.
The resulting audience profile is professionally weighted, internationally distributed, desktop-oriented on the website, and increasingly connected through email. It includes senior executives, managers, entry-level professionals, small companies, large enterprises, aerospace organizations, research institutions, government organizations, technology companies, and readers from many countries.
What the Audience Data Reveals
The three audience channels provide different but complementary information. LinkedIn emphasizes professional characteristics. Website analytics emphasize acquisition channels, countries, and devices. Newsletter analytics emphasize subscription geography, growth, and engagement.
LinkedIn demonstrates a pronounced concentration of experienced professionals. Website analytics demonstrate heavy desktop use, substantial international reach, and a dominant direct channel classification. Newsletter analytics demonstrate higher acquisition during January-July 2026 than during the matching 2025 period, broad geographic distribution, and strong interaction with delivered email.
The contrast between LinkedIn and website device use is particularly informative. LinkedIn has a 39.2% mobile share, compared with 15.0% for the website. This supports a model in which social media serves a stronger mobile discovery function and the website serves a more desktop-oriented reading and research function.
Geographic distribution adds another clear pattern. The United States represents 33.3% of both website traffic and newsletter subscribers. Website traffic also has a strong Asia-Pacific concentration, with Singapore, China, and Vietnam representing 37.9% combined. Newsletter subscribers extend across 89 identified countries.
Professional distribution is equally broad. Leadership-related seniority categories account for 77.0% of LinkedIn visitors. The three leading industry segments contribute 40.7%, yet research, government, consulting, higher education, information technology, and industrial manufacturing also appear prominently.
Company size shows similar breadth. Organizations employing one to 200 people account for 44.7% of LinkedIn visitors, giving smaller companies a strong presence. Larger organizations remain well represented, demonstrating reach across both entrepreneurial and institutional parts of the space economy.
Future audience analysis could add cohort retention, content-category preferences, return-visitor rates, newsletter-to-site click paths, search landing pages, geographic engagement by topic, and device-specific behavior. These measures would add detail to an already clear baseline.
New Space Economy reaches an audience characterized by professional experience, international distribution, strong desktop website use, substantial direct traffic, growing newsletter acquisition, and recurring email engagement.
Summary
The August 14, 2026 audience profile shows three distinct but complementary forms of engagement. LinkedIn provides the clearest professional profile, led by senior roles and industries directly connected to aerospace, space research, manufacturing, government, and related services. The website shows a strong preference for desktop access and a traffic mix dominated by direct classification. The weekly newsletter records substantially faster subscriber acquisition during January through July 2026 than during the matching 2025 period, reaches subscribers across 89 identified countries, and produces measurable opens and clicks.
The LinkedIn audience is leadership-heavy, with 77.0% of visitors represented by senior, CXO, director, vice president, owner, and manager categories. Defense and space manufacturing, space research and technology, and aviation and aerospace component manufacturing account for 40.7% of visible industry segments. Organizations employing one to 200 people account for 44.7% of visitors, giving startups and smaller businesses a substantial presence alongside major enterprises.
Website behavior is markedly desktop-oriented, with 84.4% of traffic coming from desktop devices. Direct traffic accounts for 76.3%, organic search contributes 15.1%, and the United States represents 33.3% of visits. Singapore, China, and Vietnam together contribute 37.9%, giving the website a substantial East and Southeast Asian audience.
Newsletter performance extends the picture from discovery into recurring engagement. Subscriber acquisition for January-July 2026 was 46.6% above the comparable 2025 period. Overall opens are 37.6%, overall clicks are 12.4%, and overall reactivity is 33.1%. Subscriber geography spans 89 identified countries, with the United States representing 33.3% of the audience.
Together, the channels show New Space Economy serving a professionally oriented, internationally distributed audience through several modes of use. LinkedIn supports professional discovery, the website supports desktop-centered research and reading, and the newsletter supportsrring engagement. The result is an audience profile closely aligned with a publication covering the commercial, technological, governmental, scientific, and strategic dimensions of the space economy.